This has not been converted yet, I guess:
https://www.tradingview.com/script/aMag ... Step-LSMA/
Looks interesting, doesn't it?
Re: Already Converted TradingView Indicators to MT4 Indicators
112wojtek wrote: Sat Jul 23, 2022 9:08 pm This has not been converted yet, I guess:
https://www.tradingview.com/script/aMag ... Step-LSMA/
Looks interesting, doesn't it?
Hi,
This may help.
Trend step lsma 1.2 - made by Darks sir based on tradingview - alexgrover
T-Step LSMA 03 BT
Thanks.
- These users thanked the author thomdel for the post (total 2):
- wojtek, RodrigoRT7
- Rating: 1.2%
Re: Already Converted TradingView Indicators to MT4 Indicators
113Good evening guys, how are you? sorry to insist so much on converting this indicator, but it's because I imagine it can assemble a good combination with some mt4 specifics within a renko matrix. In addition, I found a second indicator that seems to have a good synergy in keeping the trade within a continuity, that is, not to leave early. I'm sharing custom settings for everyone on the forum to review 
Thank you very much in advance.
Thank you very much in advance.
Code: Select all
// This source code is subject to the terms of the Mozilla Public License 2.0 at https://mozilla.org/MPL/2.0/
// © loxx

//@version=5
indicator("Three-Pole Super Smoother w/ EMA-Deviation-Corrected Stepping [Loxx]",
     shorttitle = "TPSSEMADCS [Loxx]",
     overlay = true,
     timeframe="",
     timeframe_gaps = true)

import loxx/loxxexpandedsourcetypes/3

greencolor = #2DD204
redcolor = #D2042D

_ssf3(src, length) =>
    arg = math.pi / length
    a1 = math.exp(-arg)
    b1 = 2 * a1 * math.cos(1.738 * arg)
    c1 = math.pow(a1, 2)
    coef4 = math.pow(c1, 2)
    coef3 = -(c1 + b1 * c1)
    coef2 = b1 + c1
    coef1 = 1 - coef2 - coef3 - coef4
    src1 = nz(src[1], src)
    src2 = nz(src[2], src1)
    src3 = nz(src[3], src2)
    ssf = 0.0
    ssf := coef1 * src + coef2 * nz(ssf[1], src1) + coef3 * nz(ssf[2], src2) + coef4 * nz(ssf[3], src3)
    ssf

_corEmaDev(avg, price, period)=>
    ema0 = 0., ema1 = 0., corr = 0.
    alpha = 2.0 / (1.0 + period)
    ema0 := ta.ema(price, period)
    ema1 := ta.ema(price*price, period)
    _deviation = math.max(math.sqrt(period * (ema1 - ema0 * ema0) / math.max(period - 1, 1)), 0.0)
    v1 = math.pow(_deviation, 2)
    v2 = math.pow(nz(corr[1]) - avg, 2)
    c = (v2 < v1 or v2 == 0) ? 0 : 1 - v1 / v2
    corr := nz(corr[1]) + c * (avg - nz(corr[1]))
    corr

smthtype = input.string("Kaufman", "Heiken-Ashi Better Smoothing", options = ["AMA", "T3", "Kaufman"], group=  "Source Settings")

srcoption = input.string("Close", "Source", group= "Source Settings",
     options =
     ["Close", "Open", "High", "Low", "Median", "Typical", "Weighted", "Average", "Average Median Body", "Trend Biased", "Trend Biased (Extreme)",
     "HA Close", "HA Open", "HA High", "HA Low", "HA Median", "HA Typical", "HA Weighted", "HA Average", "HA Average Median Body", "HA Trend Biased", "HA Trend Biased (Extreme)",
     "HAB Close", "HAB Open", "HAB High", "HAB Low", "HAB Median", "HAB Typical", "HAB Weighted", "HAB Average", "HAB Average Median Body", "HAB Trend Biased", "HAB Trend Biased (Extreme)"])

per = input.int(14, "Period", group= "Basic Settings")
colorbars = input.bool(false, "Color bars?", group= "UI Options")

kfl=input.float(0.666, title="* Kaufman's Adaptive MA (KAMA) Only - Fast End", group = "Moving Average Inputs")
ksl=input.float(0.0645, title="* Kaufman's Adaptive MA (KAMA) Only - Slow End", group = "Moving Average Inputs")
amafl = input.int(2, title="* Adaptive Moving Average (AMA) Only - Fast", group = "Moving Average Inputs")
amasl = input.int(30, title="* Adaptive Moving Average (AMA) Only - Slow", group = "Moving Average Inputs")

haclose = request.security(ticker.heikinashi(syminfo.tickerid), timeframe.period, close)
haopen = request.security(ticker.heikinashi(syminfo.tickerid), timeframe.period, open)
hahigh = request.security(ticker.heikinashi(syminfo.tickerid), timeframe.period, high)
halow = request.security(ticker.heikinashi(syminfo.tickerid), timeframe.period, low)
hamedian = request.security(ticker.heikinashi(syminfo.tickerid), timeframe.period, hl2)
hatypical = request.security(ticker.heikinashi(syminfo.tickerid), timeframe.period, hlc3)
haweighted = request.security(ticker.heikinashi(syminfo.tickerid), timeframe.period, hlcc4)
haaverage = request.security(ticker.heikinashi(syminfo.tickerid), timeframe.period, ohlc4)


float src = switch srcoption
	"Close" => loxxexpandedsourcetypes.rclose()
	"Open" => loxxexpandedsourcetypes.ropen()
	"High" => loxxexpandedsourcetypes.rhigh()
	"Low" => loxxexpandedsourcetypes.rlow()
	"Median" => loxxexpandedsourcetypes.rmedian()
	"Typical" => loxxexpandedsourcetypes.rtypical()
	"Weighted" => loxxexpandedsourcetypes.rweighted()
	"Average" => loxxexpandedsourcetypes.raverage()
    "Average Median Body" => loxxexpandedsourcetypes.ravemedbody()
	"Trend Biased" => loxxexpandedsourcetypes.rtrendb()
	"Trend Biased (Extreme)" => loxxexpandedsourcetypes.rtrendbext()
	"HA Close" => loxxexpandedsourcetypes.haclose(haclose)
	"HA Open" => loxxexpandedsourcetypes.haopen(haopen)
	"HA High" => loxxexpandedsourcetypes.hahigh(hahigh)
	"HA Low" => loxxexpandedsourcetypes.halow(halow)
	"HA Median" => loxxexpandedsourcetypes.hamedian(hamedian)
	"HA Typical" => loxxexpandedsourcetypes.hatypical(hatypical)
	"HA Weighted" => loxxexpandedsourcetypes.haweighted(haweighted)
	"HA Average" => loxxexpandedsourcetypes.haaverage(haaverage)
    "HA Average Median Body" => loxxexpandedsourcetypes.haavemedbody(haclose, haopen)
	"HA Trend Biased" => loxxexpandedsourcetypes.hatrendb(haclose, haopen, hahigh, halow)
	"HA Trend Biased (Extreme)" => loxxexpandedsourcetypes.hatrendbext(haclose, haopen, hahigh, halow)
	"HAB Close" => loxxexpandedsourcetypes.habclose(smthtype, amafl, amasl, kfl, ksl)
	"HAB Open" => loxxexpandedsourcetypes.habopen(smthtype, amafl, amasl, kfl, ksl)
	"HAB High" => loxxexpandedsourcetypes.habhigh(smthtype, amafl, amasl, kfl, ksl)
	"HAB Low" => loxxexpandedsourcetypes.hablow(smthtype, amafl, amasl, kfl, ksl)
	"HAB Median" => loxxexpandedsourcetypes.habmedian(smthtype, amafl, amasl, kfl, ksl)
	"HAB Typical" => loxxexpandedsourcetypes.habtypical(smthtype, amafl, amasl, kfl, ksl)
	"HAB Weighted" => loxxexpandedsourcetypes.habweighted(smthtype, amafl, amasl, kfl, ksl)
	"HAB Average" => loxxexpandedsourcetypes.habaverage(smthtype, amafl, amasl, kfl, ksl)
    "HAB Average Median Body" => loxxexpandedsourcetypes.habavemedbody(smthtype, amafl, amasl, kfl, ksl)
	"HAB Trend Biased" => loxxexpandedsourcetypes.habtrendb(smthtype, amafl, amasl, kfl, ksl)
	"HAB Trend Biased (Extreme)" => loxxexpandedsourcetypes.habtrendbext(smthtype, amafl, amasl, kfl, ksl)
	=> haclose

avg2 = _ssf3(src, per)
val = _corEmaDev(avg2, src, per)

goLong_pre = ta.crossover(val, val[1])
goShort_pre = ta.crossunder(val, val[1])

contSwitch = 0
contSwitch := nz(contSwitch[1])
contSwitch := goLong_pre ? 1 : goShort_pre ? -1 : contSwitch

goLong = goLong_pre and ta.change(contSwitch)
goShort = goShort_pre and ta.change(contSwitch)

plot(val,"Corrected super smoother", color = contSwitch == 1  ? greencolor : redcolor, linewidth = 3)

barcolor(colorbars ? contSwitch == 1 ? greencolor : redcolor : na)
Code: Select all
//@version=4
// This source code is subject to the terms of the Mozilla Public License 2.0 at https://mozilla.org/MPL/2.0/
// © RedKTrader

study("Comp_Ratio_MA", shorttitle = "CoRa Wave", overlay = true, resolution ="")

// ======================================================================
// Compound Ratio Weight MA function
// Compound Ratio Weight is where the weight increases in a "logarithmicly linear" way (i.e., linear when plotted on a log chart) - similar to compound ratio
// the "step ratio" between weights is consistent - that's not the case with linear-weight moving average (WMA), or EMA
// another advantage is we can significantly reduce the "tail weight" - which is "relatively" large in other MAs and contributes to lag
//
// Compound Weight ratio     r = (A/P)^1/t - 1
// Weight at time t         A = P(1 + r)^t
//                            = Start_val * (1 + r) ^ index
// Note: index is 0 at the furthest point back -- num periods = length -1
//
f_adj_crwma(source, length, Start_Wt, r_multi) =>
    numerator = 0.0, denom = 0.0, c_weight = 0.0
    //Start_Wt = 1.0    // Start Wight is an input in this version - can also be set to a basic value here.
    End_Wt = length     // use length as initial End Weight to calculate base "r"
    r = pow((End_Wt / Start_Wt),(1 / (length - 1))) - 1
    base = 1 + r * r_multi
    for i = 0 to length -1
        c_weight    := Start_Wt * pow(base,(length - i))
        numerator   := numerator + source[i] * c_weight
        denom       := denom + c_weight
    numerator / denom
// ====================================================================== ==

data        = input(title = "Source",                 type = input.source,      defval = hlc3)
length      = input(title = "length",                 type = input.integer,     defval = 20,  minval = 1)
r_multi     = input(title = "Comp Ratio Multiplier",  type = input.float,       defval = 2.0, minval = 0, step = .1)
smooth      = input(title = "Auto Smoothing",         type = input.bool,        defval = true,                    group = "Smoothing")
man_smooth  = input(title = "Manual Smoothing",       type = input.integer,     defval = 1, minval = 1, step = 1, group = "Smoothing")

s           = smooth ? max(round(sqrt(length)),1) : man_smooth
cora_raw    = f_adj_crwma(data, length, 0.01, r_multi)
cora_wave   = wma(cora_raw, s)

c_up        = color.new(color.aqua, 0)
c_dn        = color.new(#FF9800   , 0)
cora_up     = cora_wave > cora_wave[1]
plot(cora_wave, title="Adjustible CoRa_Wave", color = cora_up ? c_up : c_dn, linewidth = 3)Re: Already Converted TradingView Indicators to MT4 Indicators
114these arrows look good. (the best i've seen in a while)
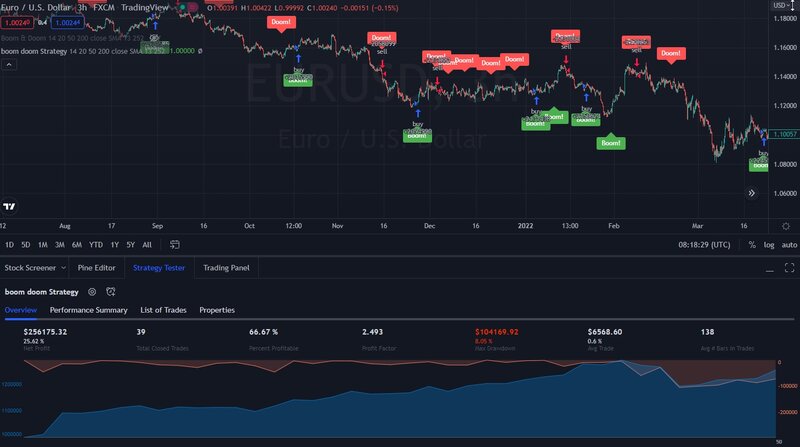 I made the code so it becomes a strategy (just copy the code into TV pine code panel and save it and add it to chart)
If you guys find a good set file then I'll convert it to MT4
thanks
Jeff
If you guys find a good set file then I'll convert it to MT4
thanks
Jeff
Code: Select all
//@version=5
//
// This source code is subject to the terms of the Mozilla Public License 2.0 at https://mozilla.org/MPL/2.0/
// © apaulcalypse


//indicator('BBWP Boom & Doom', 'Boom & Doom', overlay=true, precision=2, max_bars_back = 1000)
//@version=5
strategy("boom doom Strategy", overlay = true, default_qty_value = 100, default_qty_type = strategy.percent_of_equity, initial_capital = 1000000)


///////////////////////////////////////////////////////////////////////////////
// BBWP formula by The_Caretaker


///////////////////////////////////////////////////////////////////////////////
// inputs

volume_ma_input = input.int(14, title="Volume Moving Average", group="Boom & Doom Settings")
bbwp_minimum = input.float(20, title="BBWP Crossunder Point", step=0.1, group="Boom & Doom Settings")
bbwp_middle = input.float(50, title="BBWP Reset Point", step=0.1, group="Boom & Doom Settings")
emafilter = input.bool(false, title="Filter over/under EMA", group="Boom & Doom Settings")
emalength = input.int(200, title="EMA Length", group="Boom & Doom Settings")

// BBWP formula is by The_Caretaker
// BBWP Inputs
i_priceSrc      = input.source  ( close,    'Price Source',                                                                         group='BBWP Properties')
i_basisType     = input.string  ( 'SMA',    'Basis Type',                       options=['SMA', 'EMA', 'VWMA'],                     group='BBWP Properties')
i_bbwpLen       = input.int     ( 13,       'Length',                           minval=1,                                           group='BBWP Properties')
i_bbwpLkbk      = input.int     ( 252,      'Lookback',                         minval=1,                                           group='BBWP Properties')

///////////////////////////////////////////////////////////////////////////////
// function declarations

f_maType ( _price, _len, _type ) =>
    _type == 'SMA' ? ta.sma ( _price, _len ) : _type == 'EMA' ? ta.ema ( _price, _len ) : ta.vwma ( _price, _len )

f_bbwp ( _price, _bbwLen, _bbwpLen, _type ) =>
    float _basis = f_maType ( _price, _bbwLen, _type )
    float _dev = ta.stdev ( _price, _bbwLen )
    _bbw = ( _basis + _dev - ( _basis - _dev )) / _basis
    _bbwSum = 0.0
    _len = bar_index < _bbwpLen ? bar_index : _bbwpLen
    for _i = 1 to _len by 1
        _bbwSum += ( _bbw[_i] > _bbw ? 0 : 1 )
        _bbwSum
    _return = bar_index >= _bbwLen ? ( _bbwSum / _len) * 100 : na
    _return

f_clrSlct ( _percent, _select, _type, _solid, _array1, _array2 ) =>
    _select == 'Solid' ? _solid : array.get ( _type == 'Blue Green Red' ? _array1 : _array2, math.round ( _percent ) )

///////////////////////////////////////////////////////////////////////////////
// calculations

bbwp        = f_bbwp ( i_priceSrc, i_bbwpLen, i_bbwpLkbk, i_basisType )

// END BBWP
///////////////////////////////////////////////////////////////////////////////


// use Heikin Ashi candle data to catch momentum
openHA = request.security(ticker.heikinashi(syminfo.tickerid), timeframe.period, open)
closeHA = request.security(ticker.heikinashi(syminfo.tickerid), timeframe.period, close)
highHA = request.security(ticker.heikinashi(syminfo.tickerid), timeframe.period, high)
lowHA = request.security(ticker.heikinashi(syminfo.tickerid), timeframe.period, low)


volume_ma = ta.sma(volume, volume_ma_input)

var bbwp_lower_bound = false
var bbwp_reset = false

if ta.crossunder(bbwp, bbwp_middle)
    bbwp_reset := true

if ta.crossunder(bbwp, bbwp_minimum)
    bbwp_lower_bound := true


shadowless_rise = (openHA <= lowHA)  ? 1 : 0
shadowless_fall = (openHA >= highHA)  ? 1 : 0


boom = bbwp_lower_bound and bbwp_reset and shadowless_rise and volume > volume_ma and bbwp < 50 and bbwp > 15 ? 1 : 0
doom = bbwp_lower_bound and bbwp_reset and shadowless_fall and volume > volume_ma and bbwp < 50 and bbwp > 15 ? 1 : 0


emaline = ta.ema(close, emalength)

if emafilter and close < emaline
    boom := 0

if emafilter and close > emaline
    doom := 0


if boom or doom
    bbwp_lower_bound := false
    bbwp_reset := false

if ta.crossover(bbwp, 50) and bbwp_lower_bound == true
    bbwp_lower_bound := false


plotshape(boom ? boom : na, title='Lambo', text='Boom!', location=location.belowbar, style=shape.labelup, size=size.normal, color=color.green, textcolor=color.new(color.white, 0))
plotshape(doom ? doom : na, title='Rambo', text='Doom!', location=location.abovebar, style=shape.labeldown, size=size.normal, color=color.red, textcolor=color.new(color.white, 0))


alertcondition(boom, "Boom!", "Bullish Boom Signal")
alertcondition(doom, "Doom!", "Bearish Doom Signal")

if (boom)
	strategy.entry("Buy", strategy.long, comment="buy")
if (doom)
	strategy.entry("Sell", strategy.short, comment="sell")

// End Devastation- These users thanked the author ionone for the post:
- shinnosuke
- Rating: 0.6%
Scalping the Century TimeFrame since 1999
Re: Already Converted TradingView Indicators to MT4 Indicators
115JCFBaux Volatility [Loxx] (close, 15, 0, 300)
Can this indicator be converted to mt4?
It's one of the best for filtering low volatility and choppy markets.
Can this indicator be converted to mt4?
It's one of the best for filtering low volatility and choppy markets.
Re: Already Converted TradingView Indicators to MT4 Indicators
116You need to give the code, what you gave us doesn't help.Knight wrote: Fri Sep 02, 2022 7:28 pm JCFBaux Volatility [Loxx] (close, 15, 0, 300)
Can this indicator be converted to mt4?
It's one of the best for filtering low volatility and choppy markets.
You cannot solve a problem from the same consciousness that created it. You must learn to see the world anew
 Re: Already Converted TradingView Indicators to MT4 Indicators
117
No because you haven't bothered to:Knight wrote: Fri Sep 02, 2022 7:28 pm JCFBaux Volatility [Loxx] (close, 15, 0, 300)
Can this indicator be converted to mt4?
It's one of the best for filtering low volatility and choppy markets.
- Attach an image or chart with examples
- Show us anything except the name and settings
- Insert the code
Good luck getting coders to be interested when you're posting like this
Re: Already Converted TradingView Indicators to MT4 Indicators
118ask loxx hes on here somewhereKnight wrote: Fri Sep 02, 2022 7:28 pm JCFBaux Volatility [Loxx] (close, 15, 0, 300)
Can this indicator be converted to mt4?
It's one of the best for filtering low volatility and choppy markets.
0 + 0 = 0
Infinite / Infinite = 1
1 way to Heaven & it matters
people only serve God or money coincidence?
Infinite / Infinite = 1
1 way to Heaven & it matters
people only serve God or money coincidence?
Re: Already Converted TradingView Indicators to MT4 Indicators
119lol dis guy.........Knight wrote: Fri Sep 02, 2022 7:28 pm JCFBaux Volatility [Loxx] (close, 15, 0, 300) Can this indicator be converted to mt4?
Official Forex-station GIF animator at your service 
The best divergence indicator in the world.

The best divergence indicator in the world.
Re: Already Converted TradingView Indicators to MT4 Indicators
120my battles only make me stronger
- These users thanked the author Chickenspicy for the post:
- Jedidiah
- Rating: 0.6%
0 + 0 = 0
Infinite / Infinite = 1
1 way to Heaven & it matters
people only serve God or money coincidence?
Infinite / Infinite = 1
1 way to Heaven & it matters
people only serve God or money coincidence?