Yeah the OTT part looks like it may be a Vidya Rsi, maybe a fast rsi vidya crossing a slow rsi vidya, but not sure.Jimmy wrote: Sun Mar 27, 2022 8:02 pm Thanks for re-posting it Jeff. I've cleaned the topic and updated your original post with the new one as this one is working.
Interesting, I've just been reading up on it and OTT stands for Optimized Trend Tracker.
After comparing it to the tradingview one, this MT4 one seems a bit harder to decipher as the lines are a bit squished together.
I wonder if it's the same? Or is your code using Chande's CMO for calculation "somewhere"?
Maybe Mrtools can take a look at it, too, if he's free later. The code on TV is:
Code: Select all
//@version=4
//created by    : @Anil_Ozeksi
//developer     : @Anil_Ozeksi
//author        : @mr. fofenks

study("RISOTTO",overlay=false, precision=2)


src               = close

//RSI
x1                = input(defval = 100      , title = "VAR RSI Period"          , type = input.integer, minval = 1  ,step = 1       , group = "VAR RSI")

//OTT
x2                = input(defval = 50       , title = "RISOTTO Period"          , type = input.integer, minval = 1  ,step = 1       , group = "RISOTTO")
x3                = input(defval = 0.2      , title = "RISOTTO Percent"         , type = input.float  , minval = 0  ,step = 0.05    , group = "RISOTTO")

//Signals
showsignalsc      = input( defval=false     , title = "Show RSI/OTT Crossing Signals?", type=input.bool)

OTT_Func(src,length, percent)=>
    valpha        = 2/(length+1)
    vud1          = src>src[1] ? src-src[1] : 0
    vdd1          = src<src[1] ? src[1]-src : 0
    vUD           = sum(vud1,9)
    vDD           = sum(vdd1,9)
    vCMO          = nz((vUD-vDD)/(vUD+vDD))
    VAR           = 0.0
    VAR          := nz(valpha*abs(vCMO)*src)+(1-valpha*abs(vCMO))*nz(VAR[1])
    fark          = VAR*percent*0.01//multi*atr //
    longStop      = VAR - fark
    longStopPrev  = nz(longStop[1], longStop)
    longStop     := VAR > longStopPrev ? max(longStop, longStopPrev) : longStop
    shortStop     = VAR + fark
    shortStopPrev = nz(shortStop[1], shortStop)
    shortStop    := VAR < shortStopPrev ? min(shortStop, shortStopPrev) : shortStop
    dir           = 1
    dir          := nz(dir[1], dir)
    dir          := dir == -1 and VAR > shortStopPrev ? 1 : dir == 1 and VAR < longStopPrev ? -1 : dir
    MT            = dir==1 ? longStop: shortStop
    OTT           = VAR>MT ? MT*(200+percent)/200 : MT*(200-percent)/200
    [VAR,OTT]

rsi               = rsi(src,x1)

[VRSI,_]          = OTT_Func(rsi, x2, 1)
[_,RISOTTO]       = OTT_Func(VRSI+1000, 2, x3)

buySignalc        = crossover(VRSI+1000, RISOTTO[2])
sellSignallc      = crossunder(VRSI+1000, RISOTTO[2])

plot(VRSI+1000         , color=#0585E1     , linewidth=2, title="VAR RSI" , display = display.all)
plot(nz(RISOTTO[2])    , color=#B800D9     , linewidth=2, title="RISOTTO" , display = display.all)


plotshape(buySignalc    and showsignalsc ? RISOTTO*0.995 : na, title="Buy"  , text="Buy"    , location=location.absolute, style=shape.labelup   , size=size.tiny, color=color.green , textcolor=color.white)
plotshape(sellSignallc  and showsignalsc ? RISOTTO*1.005 : na, title="Sell" , text="Sell"   , location=location.absolute, style=shape.labeldown , size=size.tiny, color=color.red   , textcolor=color.white)

//alertcondition(cross(src, OTT[2]), title="Price Cross Alert", message="OTT - Price Crossing!")
//alertcondition(crossover(src, OTT[2]), title="Price Crossover Alarm", message="PRICE OVER OTT - BUY SIGNAL!")
//alertcondition(crossunder(src, OTT[2]), title="Price Crossunder Alarm", message="PRICE UNDER OTT - SELL SIGNAL!")
Re: RSI OTT
72Thanks for confirming bro. Thought so.mrtools wrote: Mon Mar 28, 2022 12:44 pm Yeah the OTT part looks like it may be a Vidya Rsi, maybe a fast rsi vidya crossing a slow rsi vidya, but not sure.

Re: Already Converted TradingView Indicators to MT4 Indicators
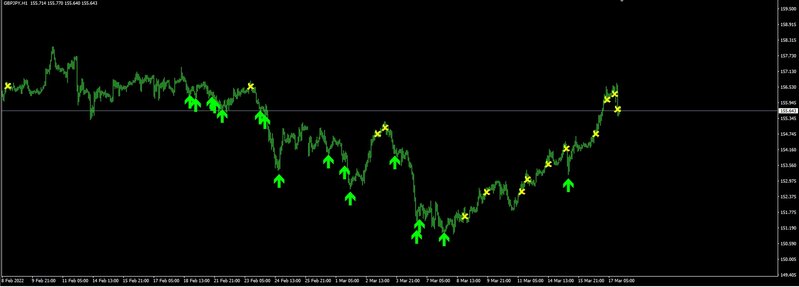
73RSI-Signals-by-HB converted from Pine Script language
buys only (exits are sells)
good signals I think.
in a good trading setup can be killer
buys only (exits are sells)
good signals I think.
in a good trading setup can be killer
Code: Select all
// This source code is subject to the terms of the Mozilla Public License 2.0 at https://mozilla.org/MPL/2.0/
// © HamidBox

//@version=4
study("RSI Signals", overlay=true, shorttitle="Advanced RSI")

//Inputs
rsiL = input(title="RSI Length", type=input.integer, defval=7)
rsiOBI = input(title="RSI Overbought", type=input.integer, defval=70)
rsiOSI = input(title="RSI Oversold", type=input.integer, defval=30)
fibLevel = input(title="Hammer Body Size", type=input.float, defval=0.333, step=0.01)
BullBearEngulf = input(title="Bullish Bearish Engulfing", type=input.bool, defval=true)
hammerShooting = input(title="Hammer Shooting Bar", type=input.bool, defval=false)
twoBullBearBar = input(title="Two Bull Bear Bar", type=input.bool, defval=false)

//RSI VALUE
myRsi = rsi(close , rsiL)

//RSI OVERBOUGHT / OVERSOLD
rsiOB = myRsi >= rsiOBI
rsiOS = myRsi <= rsiOSI

///////////=Hammer & Shooting star=/////////////

bullFib = (low - high) * fibLevel + high
bearFib = (high - low) * fibLevel + low

// Determine which price source closses or open highest/lowest
bearCandle = close < open ? close : open
bullCandle = close > open ? close : open

// Determine if we have a valid hammer or shooting star
hammer = (bearCandle >= bullFib) and rsiOS
shooting = (bullCandle <= bearFib) and rsiOB

twoGreenBars = (close > open and close[1] > open[1]) and rsiOS
twoRedBars = (close < open and close[1] < open[1]) and rsiOB

/////////////////////////////////////////////

// Engulfing candles
bullE = (close > open[1] and close[1] < open[1])
 //or hammer or twoGreenBars

bearE = close < open[1] and close[1] > open[1]
 //or shooting or twoRedBars

///////////////////////////////////////////


// ((x) y) farmula defination is: X is gona be executed before Y,
TradeSignal = ((rsiOS or rsiOS[1]) and bullE) or ((rsiOB or rsiOB[1]) and bearE)

if (TradeSignal and bearE and BullBearEngulf)
    label.new(x= bar_index, y= na, text="Exit", yloc= yloc.abovebar,color= color.maroon, textcolor= color.white, style= label.style_label_down, size=size.normal)
plotshape(TradeSignal and bearE and BullBearEngulf, title="Overbought", location=location.abovebar, color=color.orange, style=shape.triangleup, size=size.auto, text="")

if (TradeSignal and bullE and BullBearEngulf)
    label.new(x= bar_index, y= na, text="Buy", yloc= yloc.belowbar,color= color.green, textcolor= color.white, style= label.style_label_up, size=size.normal)
plotshape(TradeSignal and bullE and BullBearEngulf, title="Oversold", location=location.belowbar, color=color.lime, style=shape.triangleup, size=size.auto, text="")

//////////////////////////////

if (shooting and hammerShooting)
    label.new(x= bar_index, y= na, text="SS", yloc= yloc.abovebar,color= color.purple, textcolor= color.white, style= label.style_label_down, size=size.normal)
plotshape(shooting and hammerShooting, title="Overbought + hammer/shooting", location=location.abovebar, color=color.purple, style=shape.triangledown, size=size.auto, text="")

if (hammer and hammerShooting)
    label.new(x= bar_index, y= na, text="HMR", yloc= yloc.belowbar,color= color.blue, textcolor= color.white, style= label.style_label_up, size=size.normal)
plotshape(hammer and hammerShooting, title="Oversold + hammer/shooting", location=location.belowbar, color=color.lime, style=shape.triangledown, size=size.auto, text="")

///////////////////////////

if (twoGreenBars and twoBullBearBar)
    label.new(x= bar_index, y= na, text="2Bull", yloc= yloc.belowbar,color= color.olive, textcolor= color.white, style= label.style_label_up, size=size.normal)
plotshape(twoGreenBars and twoBullBearBar, title="Oversold + 2bulls", location=location.belowbar, color=color.lime, style=shape.triangledown, size=size.auto, text="")

if (twoRedBars and twoBullBearBar)
    label.new(x= bar_index, y= na, text="2Bear", yloc= yloc.abovebar,color= color.red, textcolor= color.white, style= label.style_label_down, size=size.normal)
plotshape(twoRedBars and twoBullBearBar, title="Overbought + 2bears", location=location.abovebar, color=color.blue, style=shape.triangledown, size=size.auto, text="")


// Send Alert if Candle meets our condition
alertcondition(TradeSignal, title="RSI SIGNAL", message="RSI Signal Detected fot {{ticker}}")- These users thanked the author ionone for the post:
- RodrigoRT7
Scalping the Century TimeFrame since 1999
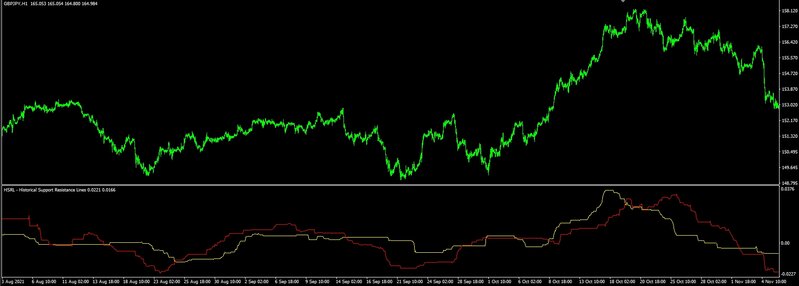
HSRL - Historical Support Resistance Lines
74converted from TradingView : HSRL - Historical Support Resistance Lines
might be usefull to ya
might be usefull to ya
Code: Select all
// This source code is subject to the terms of the Mozilla Public License 2.0 at https://mozilla.org/MPL/2.0/
// © spiritualhealer117

//@version=4
study("HSRL")
length = input(title="Length", type=input.integer, defval=150)
resistanceChange = (highest(close,length)-highest(close,length)[length])/highest(close,length)[length]
supportChange = (lowest(close,length)-lowest(close,length)[length])/lowest(close,length)[length]
HSRL = resistanceChange-supportChange

line1=plot(resistanceChange,color=color.green)
line2=plot(supportChange,color=color.red)
fill(line1,line2,color=resistanceChange>supportChange?(resistanceChange>0?color.new(color.green,50):color.new(color.red,50)):(resistanceChange>0?color.new(color.yellow,25):color.new(color.yellow,50)))
- These users thanked the author ionone for the post (total 2):
- Borshchov A.N., Jimmy
Scalping the Century TimeFrame since 1999
Re: Already Converted TradingView Indicators to MT4 Indicators
75Hello how are you? Is there a possibility to convert this indicator to MT4?
I find the sum of VQZL + Z Score assumptions interesting. not to mention that it is one of the editor picks.
Thank you very much in advance.
Volatility Qaulity Zero Line attempts to keep a trader out of ranging markets, but the original calculation on TradingView had to be adjusted for each instrument. To avoid this issue, I have applied a z-score calculation to the VQZL so the result is standardized for all instruments. A Z-Score is simply a value's relationship to the mean (average) of a group of values, measured in terms of standard deviations from the mean.
This calculation allows us to compare current volatility to the mean (moving average) of the population (Z-Length). The closer the VQZL Z-Score is to the mean, the closer it will be to the Zero Line and therefore price is likely consolidating and choppy. The farther VQZL Z-Score is from the mean, the more likely price is trending.
The MA Mode determines the Moving Average used to calculate VQZL itself. The Z-Score is ALWAYS calculated with a simple moving average (as that is the standard calculation for Z-Score).
The Threshold Levels are the levels at which VQZL Z-Score will change from gray to yellow, orange, green ( bullish ), or red ( bearish ). These levels can be adjusted but you should adjust the Threshold Lines as well (in the style section), so they line up with your adjusted values.
Statistically speaking, confidence levels in relation to Z-Score are noted below. The built in Threshold Levels are the positive and negative values for 90%, 95%, and 99%. This would indicate when volatility is greater than these values they are out of the ordinary from the standard range. You may wish to adjust these levels for VQZL Z-Score to be more responsive to your trading need
80% :: 1.28
85% :: 1.44
90% :: 1.64
95% :: 1.96
99% :: 2.58
As always, trade at your own risk.
VQZL Created by Investo And Adapted From @sarangab
Multiple MA Options Credits to @Fractured
Bits and Pieces from @AlexGrover and @Montyjus
I find the sum of VQZL + Z Score assumptions interesting. not to mention that it is one of the editor picks.
Thank you very much in advance.
Code: Select all
//@version=4
//Indicator created by Invsto
//Adapted from user @sarangab
study(title="VQZL Z Score + MA Options", shorttitle="ZVQZL")

PriceSmoothing = input(15, title="Price Smoothing")


Mode = input(title = "MA Mode", defval="SMMA", options=["TMA","ALMA", "EMA", "DEMA", "TEMA", "WMA", "VWMA", "SMA", "SMMA", "HMA", "LSMA", "JMA", "VAMA", "FRAMA", "ZLEMA", "KAMA", "Kijun", "Kijun v2", "McGinley", "IDWMA", "FLMSA", "PEMA", "HCF", "TIF", "MF", "ARMA", "DAF","WRMA", "RMA", "RAF", "GF", "A2RMA", "EDSMA"])

vq0_th = input(1.64, title="Threshold 1")
vq0_th2 = input(1.96, title="Threshold 2")
vq0_th3 = input(2.58, title="Threshold 3")

vq0_mid = 0

zlength = input(title="Z Length", defval=100, minval=1)

lsma_offset  = input(defval=0, title="* Least Squares (LSMA) Only - Offset Value", minval=0)
alma_offset  = input(defval=0.85, title="* Arnaud Legoux (ALMA) Only - Offset Value", minval=0, step=0.01) //0.85
alma_sigma   = input(defval=6, title="* Arnaud Legoux (ALMA) Only - Sigma Value", minval=0) //6
jurik_phase = input(title="* Jurik (JMA) Only - Phase", type=input.integer, defval=50)
jurik_power = input(title="* Jurik (JMA) Only - Power", type=input.integer, defval=2)
volatility_lookback = input(51, title="* Volatility Adjusted (VAMA) Only - Volatility lookback length")
frama_FC = input(defval=1,minval=1, title="* Fractal Adjusted (FRAMA) Only - FC")
frama_SC = input(defval=200,minval=1, title="* Fractal Adjusted (FRAMA) Only - SC")
kama_fast_len = input(title="* Kaufman (KAMA) Only - Fast EMA Length", type=input.integer, defval=2)
kama_slow_len = input(title="* Kaufman (KAMA) Only - Slow EMA Length", type=input.integer, defval=30)
center = input(defval=10, title="* Trend Impulse Filter Only - Center")

//MF
beta = input(0.8,minval=0,maxval=1, title="Modular Filter, General Filter Only - Beta")
feedback = input(false, title="Modular Filter Only - Feedback")
z = input(0.5,title="Modular Filter Only - Feedback Weighting",minval=0,maxval=1)

//ARMA
gamma = input(3.,type=input.float, title="ARMA, A2RMA, General Filter Gamma")
zl = input(false,title="ARMA, DAF, WRMA, Zero-Lag")

//GF
zeta = input(1,maxval=1,type=input.float,title="General Filter Zeta")

//EDSMA
ssfLength = input(title="EDSMA - Super Smoother Filter Length", type=input.integer, minval=1, defval=20)
ssfPoles = input(title="EDSMA - Super Smoother Filter Poles", type=input.integer, defval=2, options=[2, 3])

//IDWMA
calcWeight(src, length, i) =>
    distanceSum = 0.0
    for j = 0 to length - 1
        distanceSum := distanceSum + abs(nz(src[i]) - nz(src[j]))
    distanceSum

//HCF
//study("Hybrid Convolution Filter",overlay=true)
//length = input(14)
//----
f(x) =>
    .5*(1 - cos(x*3.14159))

d(x,length) =>
    f(x/length) - f((x-1)/length)
//----
filter(a,b,length) =>
    sum = 0.
    for i = 1 to length
        sgn = f(i/length)
        sum := sum + (sgn*b + (1 - sgn)*a[i-1]) * d(i,length)
    sum
//----

//A2RMA
ama(er,x)=>
    a = 0.
    a := er*x+(1-er)*nz(a[1],x)


//EDSMA
get2PoleSSF(src, length) =>
    PI = 2 * asin(1)
    arg = sqrt(2) * PI / length
    a1 = exp(-arg)
    b1 = 2 * a1 * cos(arg)
    c2 = b1
    c3 = -pow(a1, 2)
    c1 = 1 - c2 - c3

    ssf = 0.0
    ssf := c1 * src + c2 * nz(ssf[1]) + c3 * nz(ssf[2])

get3PoleSSF(src, length) =>
    PI = 2 * asin(1)

    arg = PI / length
    a1 = exp(-arg)
    b1 = 2 * a1 * cos(1.738 * arg)
    c1 = pow(a1, 2)

    coef2 = b1 + c1
    coef3 = -(c1 + b1 * c1)
    coef4 = pow(c1, 2)
    coef1 = 1 - coef2 - coef3 - coef4

    ssf = 0.0
    ssf := coef1 * src + coef2 * nz(ssf[1]) + coef3 * nz(ssf[2]) + coef4 * nz(ssf[3])


ma(type, src, len) =>
    float result = 0
    if type=="TMA"
        result := sma(sma(src, ceil(len / 2)), floor(len / 2) + 1)
    if type=="SMA" // Simple
        result := sma(src, len)
    if type=="EMA" // Exponential
        result := ema(src, len)
    if type=="DEMA" // Double Exponential
        e = ema(src, len)
        result := 2 * e - ema(e, len)
    if type=="TEMA" // Triple Exponential
        e = ema(src, len)
        result := 3 * (e - ema(e, len)) + ema(ema(e, len), len)
    if type=="WMA" // Weighted
        result := wma(src, len)
    if type=="VWMA" // Volume Weighted
        result := vwma(src, len)
    if type=="SMMA" // Smoothed
        w = wma(src, len)
        result := na(w[1]) ? sma(src, len) : (w[1] * (len - 1) + src) / len
    if type=="HMA" // Hull
        result := wma(2 * wma(src, len / 2) - wma(src, len), round(sqrt(len)))
    if type=="LSMA" // Least Squares
        result := linreg(src, len, lsma_offset)
    if type=="ALMA" // Arnaud Legoux
        result := alma(src, len, alma_offset, alma_sigma)
    if type=="JMA" // Jurik
        /// Copyright © 2018 Alex Orekhov (everget)
        /// Copyright © 2017 Jurik Research and Consulting.
        phaseRatio = jurik_phase < -100 ? 0.5 : jurik_phase > 100 ? 2.5 : jurik_phase / 100 + 1.5
        beta = 0.45 * (len - 1) / (0.45 * (len - 1) + 2)
        alpha = pow(beta, jurik_power)
        jma = 0.0
        e0 = 0.0
        e0 := (1 - alpha) * src + alpha * nz(e0[1])
        e1 = 0.0
        e1 := (src - e0) * (1 - beta) + beta * nz(e1[1])
        e2 = 0.0
        e2 := (e0 + phaseRatio * e1 - nz(jma[1])) * pow(1 - alpha, 2) + pow(alpha, 2) * nz(e2[1])
        jma := e2 + nz(jma[1])
        result := jma
    if type=="VAMA" // Volatility Adjusted
        /// Copyright © 2019 to present, Joris Duyck (JD)
        mid=ema(src,len)
        dev=src-mid
        vol_up=highest(dev,volatility_lookback)
        vol_down=lowest(dev,volatility_lookback)
        result := mid+avg(vol_up,vol_down)
    if type=="FRAMA" // Fractal Adaptive
        int len1 = len/2
        e = 2.7182818284590452353602874713527
        w = log(2/(frama_SC+1)) / log(e) // Natural logarithm (ln(2/(SC+1))) workaround
        H1 = highest(high,len1)
        L1 = lowest(low,len1)
        N1 = (H1-L1)/len1
        H2_ = highest(high,len1)
        H2 = H2_[len1]
        L2_ = lowest(low,len1)
        L2 = L2_[len1]
        N2 = (H2-L2)/len1
        H3 = highest(high,len)
        L3 = lowest(low,len)
        N3 = (H3-L3)/len
        dimen1 = (log(N1+N2)-log(N3))/log(2)
        dimen = iff(N1>0 and N2>0 and N3>0,dimen1,nz(dimen1[1]))
        alpha1 = exp(w*(dimen-1))
        oldalpha = alpha1>1?1:(alpha1<0.01?0.01:alpha1)
        oldN = (2-oldalpha)/oldalpha
        N = (((frama_SC-frama_FC)*(oldN-1))/(frama_SC-1))+frama_FC
        alpha_ = 2/(N+1)
        alpha = alpha_<2/(frama_SC+1)?2/(frama_SC+1):(alpha_>1?1:alpha_)
        frama = 0.0
        frama :=(1-alpha)*nz(frama[1]) + alpha*src
        result := frama
    if type=="ZLEMA" // Zero-Lag EMA
        f_lag = (len - 1) / 2
        f_data = src + (src - src[f_lag])
        result := ema(f_data, len)
    if type=="KAMA" // Kaufman Adaptive
        mom = abs(change(src, len))
        volatility = sum(abs(change(src)), len)
        er = volatility != 0 ? mom / volatility : 0
        fastAlpha = 2 / (kama_fast_len + 1)
        slowAlpha = 2 / (kama_slow_len + 1)
        sc = pow((er * (fastAlpha - slowAlpha)) + slowAlpha, 2)
        kama = 0.0
        kama := sc * src + (1 - sc) * nz(kama[1])
        result := kama
    if type=="Kijun" //Kijun-sen
        kijun = avg(lowest(len), highest(len))
        result :=kijun
    if type=="Kijun v2"
        kijun = avg(lowest(len), highest(len))
        conversionLine = avg(lowest(len/2), highest(len/2))
        delta = (kijun + conversionLine)/2
        result :=delta
    if type=="McGinley"
        mg = 0.0
        mg := na(mg[1]) ? ema(src, len) : mg[1] + (src - mg[1]) / (len * pow(src/mg[1], 4))
        result :=mg
    if type=="IDWMA"
        sum = 0.0
        weightSum = 0.0
        for i = 0 to len - 1
            weight = calcWeight(src, len, i)
            sum := sum + nz(src[i]) * weight
            weightSum := weightSum + weight
        idwma = sum / weightSum
        result := idwma
    if type=="FLMSA"
        n = bar_index
        b = 0.
        e = sma(abs(src - nz(b[1])),len)
        z = sma(src - nz(b[1],src),len)/e
        r = (exp(2*z) - 1)/(exp(2*z) + 1)
        a = (n - sma(n,len))/stdev(n,len) * r
        b := sma(src,len) + a*stdev(src,len)
        result := b
    if type=="PEMA"
        // Copyright (c) 2010-present, Bruno Pio
        // Copyright (c) 2019-present, Alex Orekhov (everget)
        // Pentuple Exponential Moving Average script may be freely distributed under the MIT license.
        ema1 = ema(src, len)
        ema2 = ema(ema1, len)
        ema3 = ema(ema2, len)
        ema4 = ema(ema3, len)
        ema5 = ema(ema4, len)
        ema6 = ema(ema5, len)
        ema7 = ema(ema6, len)
        ema8 = ema(ema7, len)
        pema = 8 * ema1 - 28 * ema2 + 56 * ema3 - 70 * ema4 + 56 * ema5 - 28 * ema6 + 8 * ema7 - ema8
        result := pema
    if type=="HCF"
        output = 0.
        output := filter(src, nz(output[1],src), len)
        result := output
    if type=="TIF"
        b = 0.0
        a = rising(src,len) or falling(src,len) ? 1 : 0
        b := ema(a*src+(1-a)*nz(b[1],src),center)
        result := b
    if type=="MF"
        ts=0.,b=0.,c=0.,os=0.
        //----
        alpha = 2/(len+1)
        a = feedback ? z*src + (1-z)*nz(ts[1],src) : src
        //----
        b := a > alpha*a+(1-alpha)*nz(b[1],a) ? a : alpha*a+(1-alpha)*nz(b[1],a)
        c := a < alpha*a+(1-alpha)*nz(c[1],a) ? a : alpha*a+(1-alpha)*nz(c[1],a)
        os := a == b ? 1 : a == c ? 0 : os[1]
        //----
        upper = beta*b+(1-beta)*c
        lower = beta*c+(1-beta)*b
        ts := os*upper+(1-os)*lower
        result := ts
    if type=="ARMA"
    //----
        ma = 0.
        mad = 0.
        //----
        src2 = zl ? src + change(src,len/2) : src
        ma := nz(mad[1],src2)
        d = cum(abs(src2[len] - ma))/bar_index * gamma
        mad := sma(sma(src2 > nz(mad[1],src2) + d ? src2 + d : src2 < nz(mad[1],src) - d ? src2 - d : nz(mad[1],src2),len),len)
        result := mad
    if type=="DAF"
        AC = zl ? 1 : 0
        out = 0.
        K = 0.
        //----
        src2 = src + (src - nz(out[1],src))
        out := nz(out[1],src2) + nz(K[1])*(src2 - nz(out[1],src2)) + AC*(nz(K[1])*(src2 - sma(src2,len)))
        K := abs(src2 - out)/(abs(src2 - out) + stdev(src2,len)*len)
        result := out
    if type=="WRMA"
        //----
        alpha = 2/(len+1)
        p1 = zl ? len/4 : 1
        p2 = zl ? len/4 : len/2
        //----
        a = 0.0
        b = 0.0
        A = 0.0
        B = 0.0
        a := nz(a[1]) + alpha*nz(A[1])
        b := nz(b[1]) + alpha*nz(B[1])
        y = ema(a + b,p1)
        A := src - y
        B := src - ema(y,p2)
        result := y
        //----
    if type=="RMA"
        ma = sma(src,len*3) + sma(src,len*2) - sma(src,len)
        result := ma
    if type=="RAF"
        altma = 0.0
        AR = 2*(highest(len) - lowest(len))
        BR = 2*(highest(len*2) - lowest(len*2))
        k1 = (1 - AR)/AR
        k2 = (1 - BR)/BR
        //
        alpha = k2/k1
        R1 = sqrt(highest(len))/4 * ((alpha - 1)/alpha) * (k2/(k2 + 1))
        R2 = sqrt(highest(len*2))/4 * (alpha - 1) * (k1/(k1 + 1))
        Factor = R2/R1
        //
        AltK = fixnan(pow(Factor >= 1 ? 1 : Factor,sqrt(len)))*(1/len)
        altma := AltK*src+(1-AltK)*nz(altma[1],src)
        result := altma
    if type=="GF"
        ////////////////////////////////////////////////////////////////
        //Coefficients Table :
        //
        //MA : beta = 2/gamma = 0.5
        //EMA : beta = 3/gamma = 0.4
        //HMA = beta = 4/gamma = 0.85
        //LSMA : beta = 3.5/gamma = 0.9
        //QLSMA : beta = 5.25/gamma = 1
        //JMA : beta = pow*2/gamma = 0.5
        //3 Poles Butterworth Filter : beta = 5.5/gamma = 0.5/zeta = 0
        //
        ////////////////////////////////////////////////////////////////
        b = 0.0
        d = 0.0
        p = len/beta
        a = src - nz(b[p],src)
        b := nz(b[1],src) + a/p*gamma
        c = b - nz(d[p],b)
        d := nz(d[1],src) + (zeta*a+(1-zeta)*c)/p*gamma
        result := d
    if type=="A2RMA"
        er = abs(change(src,len))/sum(abs(change(src)),len)
        //----
        ma = 0.
        d = cum(abs(src - nz(ma[1],src)))/bar_index * gamma
        ma := ama(er,ama(er,src > nz(ma[1],src) + d ? src + d : src < nz(ma[1],src) - d ? src - d : nz(ma[1],src)))
        //----
        result := ma
    if type=="EDSMA"

        zeros = src - nz(src[2])
        avgZeros = (zeros + zeros[1]) / 2

        // Ehlers Super Smoother Filter
        ssf = ssfPoles == 2
             ? get2PoleSSF(avgZeros, ssfLength)
             : get3PoleSSF(avgZeros, ssfLength)

        // Rescale filter in terms of Standard Deviations
        stdev = stdev(ssf, len)
        scaledFilter = stdev != 0
             ? ssf / stdev
             : 0

        alpha = 5 * abs(scaledFilter) / len

        edsma = 0.0
        edsma := alpha * src + (1 - alpha) * nz(edsma[1])
        result :=  edsma
    result

//---parameters

cHigh = ma(Mode,high, PriceSmoothing)
cLow = ma(Mode,low, PriceSmoothing)
cOpen = ma(Mode,open, PriceSmoothing)
cClose = ma(Mode,close, PriceSmoothing)
pClose = cClose[1]

trueRange = max(cHigh, cClose) - min(cLow, pClose)
rrange = cHigh - cLow

vqi = 0.0
vqi := rrange != 0 and trueRange != 0 ?
   ((cClose - pClose) / trueRange + (cClose - cOpen) / rrange) * 0.5 : 0  //vqi[1]

vqi_abs = abs(vqi) * (cClose - pClose + cClose - cOpen) * 0.5
//sumVqi = vqi_abs //v1.0
sumVqi = abs(vqi_abs) > 1 ? vqi_abs : abs(vqi_abs) * 10 > 1 ? vqi_abs * 10 : vqi_abs


//plot(sumVqi, color=secolor, title="VQI", linewidth=2)
hline(0, title = "Zero", color=color.white, linestyle=hline.style_dotted, linewidth=1)
hline(1.64, title = "90% Line - Threshold 1", color=color.black, linestyle=hline.style_dotted, linewidth=1)
hline(-1.64, title = "90% Line - Threshold 1", color=color.black, linestyle=hline.style_dotted, linewidth=1)
hline(1.96, title = "95% Line - Threshold 2", color=color.black, linestyle=hline.style_dotted, linewidth=1)
hline(-1.96, title = "95% Line - Threshold 2", color=color.black, linestyle=hline.style_dotted, linewidth=1)
hline(2.58, title = "99% Line - Threshold 3", color=color.black, linestyle=hline.style_dotted, linewidth=1)
hline(-2.58, title = "99% Line - Threshold 3", color=color.black, linestyle=hline.style_dotted, linewidth=1)

///// Z SCORE CALCULATION


VQI = sumVqi
xStdDev = stdev(VQI, zlength)
xMA = sma(VQI, zlength)
z2=(VQI-xMA)/xStdDev

PAL = (z2 > 0)
PAS = (z2 < 0)

chgPAL = PAL and not PAL[1]
chgPAS = PAS and not PAS[1]

secolor = z2 > (vq0_mid + vq0_th) and z2 < (vq0_mid + vq0_th2) ? color.yellow : z2 > (vq0_mid + vq0_th2) and z2 < (vq0_mid + vq0_th3) ? color.orange : z2 > (vq0_mid + vq0_th3) ? color.green : z2 < (vq0_mid - vq0_th) and z2 > (vq0_mid - vq0_th2) ? color.yellow : z2 < (vq0_mid - vq0_th2) and z2 > (vq0_mid - vq0_th3) ? color.orange : z2 < (vq0_mid - vq0_th3) ? color.red : color.gray

plot(z2, title = "Z Score ATR", color=secolor,style=plot.style_area, transp=0)

//bgcolor(chgPAL ? color.green : chgPAS ? color.red : na, transp=80, title="Change in Price Action")
//plotshape(PAL, title="Price Action Long", location=location.bottom, style=shape.square, size=size.auto, color=color.green, transp=20)
//plotshape(PAS, title="Price Action Short", location=location.bottom, style=shape.square, size=size.auto, color=color.red, transp=20)
Volatility Qaulity Zero Line attempts to keep a trader out of ranging markets, but the original calculation on TradingView had to be adjusted for each instrument. To avoid this issue, I have applied a z-score calculation to the VQZL so the result is standardized for all instruments. A Z-Score is simply a value's relationship to the mean (average) of a group of values, measured in terms of standard deviations from the mean.
This calculation allows us to compare current volatility to the mean (moving average) of the population (Z-Length). The closer the VQZL Z-Score is to the mean, the closer it will be to the Zero Line and therefore price is likely consolidating and choppy. The farther VQZL Z-Score is from the mean, the more likely price is trending.
The MA Mode determines the Moving Average used to calculate VQZL itself. The Z-Score is ALWAYS calculated with a simple moving average (as that is the standard calculation for Z-Score).
The Threshold Levels are the levels at which VQZL Z-Score will change from gray to yellow, orange, green ( bullish ), or red ( bearish ). These levels can be adjusted but you should adjust the Threshold Lines as well (in the style section), so they line up with your adjusted values.
Statistically speaking, confidence levels in relation to Z-Score are noted below. The built in Threshold Levels are the positive and negative values for 90%, 95%, and 99%. This would indicate when volatility is greater than these values they are out of the ordinary from the standard range. You may wish to adjust these levels for VQZL Z-Score to be more responsive to your trading need
80% :: 1.28
85% :: 1.44
90% :: 1.64
95% :: 1.96
99% :: 2.58
As always, trade at your own risk.
VQZL Created by Investo And Adapted From @sarangab
Multiple MA Options Credits to @Fractured
Bits and Pieces from @AlexGrover and @Montyjus
Re: Already Converted TradingView Indicators to MT4 Indicators
76sounds interesting .
- These users thanked the author maswalty for the post:
- RodrigoRT7
Pivot-Point Weighted Moving Average 1.0
77Pivot-Point Weighted Moving Average 1.0
The Pivot-Point Weighted MA is very different from other weighted MAs, in the sense that the price weights can achieve negative values. For an example, if a length of 21 is used, the pivot point will be calculated as 13, meaning that the 13th prior candle will have 0 weight, and all prices before it will have a negative weight on the sum, so their impact is reversed rather than just unweighted.
The intent of this is to reduce lag by front-loading the prices. It works better in cyclic markets, and with a longer length, where the inflection point (the one with 0 weight) is aligned with the cyclic turn.
You can configure where the weight starts. If you leave it as 0, it will start with floor(length * 0.66) - 1.
Code: Select all
// This source code is subject to the terms of the Mozilla Public License 2.0 at https://mozilla.org/MPL/2.0/
// © EduardoMattje

//@version=5
indicator("Pivot-Point Weighted Moving Average", "PPWMA", overlay=true)

var startingWeight = input.int(0, "Starting weight")
var length = input.int(21, "Length")
price = input.source(close, "Price source")

pivotPointAverage = 0.0
weight = startingWeight

if weight == 0
    weight := math.floor(length * 2/3) - 1

sum = 0.0
sumWeight = 0.0

for ix = 1 to length
    sum := sum + weight * price[ix - 1]
    sumWeight := sumWeight + weight
    weight := weight - 1

if sumWeight != 0
	pivotPointAverage := sum / sumWeight
else
	pivotPointAverage := 0.0

plot(pivotPointAverage)- These users thanked the author ionone for the post (total 3):
- Ogee, Chickenspicy, RodrigoRT7
Scalping the Century TimeFrame since 1999
Re: Already Converted TradingView Indicators to MT4 Indicators
78Can't find anything how they made it so smooth, made a version but it's not close to the one depicted.RodrigoRT7 wrote: Mon Jun 06, 2022 5:29 am Hello how are you? Is there a possibility to convert this indicator to MT4?
I find the sum of VQZL + Z Score assumptions interesting. not to mention that it is one of the editor picks.
Thank you very much in advance.
Code: Select all
//@version=4
//Indicator created by Invsto
//Adapted from user @sarangab
study(title="VQZL Z Score + MA Options", shorttitle="ZVQZL")

PriceSmoothing = input(15, title="Price Smoothing")


Mode = input(title = "MA Mode", defval="SMMA", options=["TMA","ALMA", "EMA", "DEMA", "TEMA", "WMA", "VWMA", "SMA", "SMMA", "HMA", "LSMA", "JMA", "VAMA", "FRAMA", "ZLEMA", "KAMA", "Kijun", "Kijun v2", "McGinley", "IDWMA", "FLMSA", "PEMA", "HCF", "TIF", "MF", "ARMA", "DAF","WRMA", "RMA", "RAF", "GF", "A2RMA", "EDSMA"])

vq0_th = input(1.64, title="Threshold 1")
vq0_th2 = input(1.96, title="Threshold 2")
vq0_th3 = input(2.58, title="Threshold 3")

vq0_mid = 0

zlength = input(title="Z Length", defval=100, minval=1)

lsma_offset  = input(defval=0, title="* Least Squares (LSMA) Only - Offset Value", minval=0)
alma_offset  = input(defval=0.85, title="* Arnaud Legoux (ALMA) Only - Offset Value", minval=0, step=0.01) //0.85
alma_sigma   = input(defval=6, title="* Arnaud Legoux (ALMA) Only - Sigma Value", minval=0) //6
jurik_phase = input(title="* Jurik (JMA) Only - Phase", type=input.integer, defval=50)
jurik_power = input(title="* Jurik (JMA) Only - Power", type=input.integer, defval=2)
volatility_lookback = input(51, title="* Volatility Adjusted (VAMA) Only - Volatility lookback length")
frama_FC = input(defval=1,minval=1, title="* Fractal Adjusted (FRAMA) Only - FC")
frama_SC = input(defval=200,minval=1, title="* Fractal Adjusted (FRAMA) Only - SC")
kama_fast_len = input(title="* Kaufman (KAMA) Only - Fast EMA Length", type=input.integer, defval=2)
kama_slow_len = input(title="* Kaufman (KAMA) Only - Slow EMA Length", type=input.integer, defval=30)
center = input(defval=10, title="* Trend Impulse Filter Only - Center")

//MF
beta = input(0.8,minval=0,maxval=1, title="Modular Filter, General Filter Only - Beta")
feedback = input(false, title="Modular Filter Only - Feedback")
z = input(0.5,title="Modular Filter Only - Feedback Weighting",minval=0,maxval=1)

//ARMA
gamma = input(3.,type=input.float, title="ARMA, A2RMA, General Filter Gamma")
zl = input(false,title="ARMA, DAF, WRMA, Zero-Lag")

//GF
zeta = input(1,maxval=1,type=input.float,title="General Filter Zeta")

//EDSMA
ssfLength = input(title="EDSMA - Super Smoother Filter Length", type=input.integer, minval=1, defval=20)
ssfPoles = input(title="EDSMA - Super Smoother Filter Poles", type=input.integer, defval=2, options=[2, 3])

//IDWMA
calcWeight(src, length, i) =>
    distanceSum = 0.0
    for j = 0 to length - 1
        distanceSum := distanceSum + abs(nz(src[i]) - nz(src[j]))
    distanceSum

//HCF
//study("Hybrid Convolution Filter",overlay=true)
//length = input(14)
//----
f(x) =>
    .5*(1 - cos(x*3.14159))

d(x,length) =>
    f(x/length) - f((x-1)/length)
//----
filter(a,b,length) =>
    sum = 0.
    for i = 1 to length
        sgn = f(i/length)
        sum := sum + (sgn*b + (1 - sgn)*a[i-1]) * d(i,length)
    sum
//----

//A2RMA
ama(er,x)=>
    a = 0.
    a := er*x+(1-er)*nz(a[1],x)


//EDSMA
get2PoleSSF(src, length) =>
    PI = 2 * asin(1)
    arg = sqrt(2) * PI / length
    a1 = exp(-arg)
    b1 = 2 * a1 * cos(arg)
    c2 = b1
    c3 = -pow(a1, 2)
    c1 = 1 - c2 - c3

    ssf = 0.0
    ssf := c1 * src + c2 * nz(ssf[1]) + c3 * nz(ssf[2])

get3PoleSSF(src, length) =>
    PI = 2 * asin(1)

    arg = PI / length
    a1 = exp(-arg)
    b1 = 2 * a1 * cos(1.738 * arg)
    c1 = pow(a1, 2)

    coef2 = b1 + c1
    coef3 = -(c1 + b1 * c1)
    coef4 = pow(c1, 2)
    coef1 = 1 - coef2 - coef3 - coef4

    ssf = 0.0
    ssf := coef1 * src + coef2 * nz(ssf[1]) + coef3 * nz(ssf[2]) + coef4 * nz(ssf[3])


ma(type, src, len) =>
    float result = 0
    if type=="TMA"
        result := sma(sma(src, ceil(len / 2)), floor(len / 2) + 1)
    if type=="SMA" // Simple
        result := sma(src, len)
    if type=="EMA" // Exponential
        result := ema(src, len)
    if type=="DEMA" // Double Exponential
        e = ema(src, len)
        result := 2 * e - ema(e, len)
    if type=="TEMA" // Triple Exponential
        e = ema(src, len)
        result := 3 * (e - ema(e, len)) + ema(ema(e, len), len)
    if type=="WMA" // Weighted
        result := wma(src, len)
    if type=="VWMA" // Volume Weighted
        result := vwma(src, len)
    if type=="SMMA" // Smoothed
        w = wma(src, len)
        result := na(w[1]) ? sma(src, len) : (w[1] * (len - 1) + src) / len
    if type=="HMA" // Hull
        result := wma(2 * wma(src, len / 2) - wma(src, len), round(sqrt(len)))
    if type=="LSMA" // Least Squares
        result := linreg(src, len, lsma_offset)
    if type=="ALMA" // Arnaud Legoux
        result := alma(src, len, alma_offset, alma_sigma)
    if type=="JMA" // Jurik
        /// Copyright © 2018 Alex Orekhov (everget)
        /// Copyright © 2017 Jurik Research and Consulting.
        phaseRatio = jurik_phase < -100 ? 0.5 : jurik_phase > 100 ? 2.5 : jurik_phase / 100 + 1.5
        beta = 0.45 * (len - 1) / (0.45 * (len - 1) + 2)
        alpha = pow(beta, jurik_power)
        jma = 0.0
        e0 = 0.0
        e0 := (1 - alpha) * src + alpha * nz(e0[1])
        e1 = 0.0
        e1 := (src - e0) * (1 - beta) + beta * nz(e1[1])
        e2 = 0.0
        e2 := (e0 + phaseRatio * e1 - nz(jma[1])) * pow(1 - alpha, 2) + pow(alpha, 2) * nz(e2[1])
        jma := e2 + nz(jma[1])
        result := jma
    if type=="VAMA" // Volatility Adjusted
        /// Copyright © 2019 to present, Joris Duyck (JD)
        mid=ema(src,len)
        dev=src-mid
        vol_up=highest(dev,volatility_lookback)
        vol_down=lowest(dev,volatility_lookback)
        result := mid+avg(vol_up,vol_down)
    if type=="FRAMA" // Fractal Adaptive
        int len1 = len/2
        e = 2.7182818284590452353602874713527
        w = log(2/(frama_SC+1)) / log(e) // Natural logarithm (ln(2/(SC+1))) workaround
        H1 = highest(high,len1)
        L1 = lowest(low,len1)
        N1 = (H1-L1)/len1
        H2_ = highest(high,len1)
        H2 = H2_[len1]
        L2_ = lowest(low,len1)
        L2 = L2_[len1]
        N2 = (H2-L2)/len1
        H3 = highest(high,len)
        L3 = lowest(low,len)
        N3 = (H3-L3)/len
        dimen1 = (log(N1+N2)-log(N3))/log(2)
        dimen = iff(N1>0 and N2>0 and N3>0,dimen1,nz(dimen1[1]))
        alpha1 = exp(w*(dimen-1))
        oldalpha = alpha1>1?1:(alpha1<0.01?0.01:alpha1)
        oldN = (2-oldalpha)/oldalpha
        N = (((frama_SC-frama_FC)*(oldN-1))/(frama_SC-1))+frama_FC
        alpha_ = 2/(N+1)
        alpha = alpha_<2/(frama_SC+1)?2/(frama_SC+1):(alpha_>1?1:alpha_)
        frama = 0.0
        frama :=(1-alpha)*nz(frama[1]) + alpha*src
        result := frama
    if type=="ZLEMA" // Zero-Lag EMA
        f_lag = (len - 1) / 2
        f_data = src + (src - src[f_lag])
        result := ema(f_data, len)
    if type=="KAMA" // Kaufman Adaptive
        mom = abs(change(src, len))
        volatility = sum(abs(change(src)), len)
        er = volatility != 0 ? mom / volatility : 0
        fastAlpha = 2 / (kama_fast_len + 1)
        slowAlpha = 2 / (kama_slow_len + 1)
        sc = pow((er * (fastAlpha - slowAlpha)) + slowAlpha, 2)
        kama = 0.0
        kama := sc * src + (1 - sc) * nz(kama[1])
        result := kama
    if type=="Kijun" //Kijun-sen
        kijun = avg(lowest(len), highest(len))
        result :=kijun
    if type=="Kijun v2"
        kijun = avg(lowest(len), highest(len))
        conversionLine = avg(lowest(len/2), highest(len/2))
        delta = (kijun + conversionLine)/2
        result :=delta
    if type=="McGinley"
        mg = 0.0
        mg := na(mg[1]) ? ema(src, len) : mg[1] + (src - mg[1]) / (len * pow(src/mg[1], 4))
        result :=mg
    if type=="IDWMA"
        sum = 0.0
        weightSum = 0.0
        for i = 0 to len - 1
            weight = calcWeight(src, len, i)
            sum := sum + nz(src[i]) * weight
            weightSum := weightSum + weight
        idwma = sum / weightSum
        result := idwma
    if type=="FLMSA"
        n = bar_index
        b = 0.
        e = sma(abs(src - nz(b[1])),len)
        z = sma(src - nz(b[1],src),len)/e
        r = (exp(2*z) - 1)/(exp(2*z) + 1)
        a = (n - sma(n,len))/stdev(n,len) * r
        b := sma(src,len) + a*stdev(src,len)
        result := b
    if type=="PEMA"
        // Copyright (c) 2010-present, Bruno Pio
        // Copyright (c) 2019-present, Alex Orekhov (everget)
        // Pentuple Exponential Moving Average script may be freely distributed under the MIT license.
        ema1 = ema(src, len)
        ema2 = ema(ema1, len)
        ema3 = ema(ema2, len)
        ema4 = ema(ema3, len)
        ema5 = ema(ema4, len)
        ema6 = ema(ema5, len)
        ema7 = ema(ema6, len)
        ema8 = ema(ema7, len)
        pema = 8 * ema1 - 28 * ema2 + 56 * ema3 - 70 * ema4 + 56 * ema5 - 28 * ema6 + 8 * ema7 - ema8
        result := pema
    if type=="HCF"
        output = 0.
        output := filter(src, nz(output[1],src), len)
        result := output
    if type=="TIF"
        b = 0.0
        a = rising(src,len) or falling(src,len) ? 1 : 0
        b := ema(a*src+(1-a)*nz(b[1],src),center)
        result := b
    if type=="MF"
        ts=0.,b=0.,c=0.,os=0.
        //----
        alpha = 2/(len+1)
        a = feedback ? z*src + (1-z)*nz(ts[1],src) : src
        //----
        b := a > alpha*a+(1-alpha)*nz(b[1],a) ? a : alpha*a+(1-alpha)*nz(b[1],a)
        c := a < alpha*a+(1-alpha)*nz(c[1],a) ? a : alpha*a+(1-alpha)*nz(c[1],a)
        os := a == b ? 1 : a == c ? 0 : os[1]
        //----
        upper = beta*b+(1-beta)*c
        lower = beta*c+(1-beta)*b
        ts := os*upper+(1-os)*lower
        result := ts
    if type=="ARMA"
    //----
        ma = 0.
        mad = 0.
        //----
        src2 = zl ? src + change(src,len/2) : src
        ma := nz(mad[1],src2)
        d = cum(abs(src2[len] - ma))/bar_index * gamma
        mad := sma(sma(src2 > nz(mad[1],src2) + d ? src2 + d : src2 < nz(mad[1],src) - d ? src2 - d : nz(mad[1],src2),len),len)
        result := mad
    if type=="DAF"
        AC = zl ? 1 : 0
        out = 0.
        K = 0.
        //----
        src2 = src + (src - nz(out[1],src))
        out := nz(out[1],src2) + nz(K[1])*(src2 - nz(out[1],src2)) + AC*(nz(K[1])*(src2 - sma(src2,len)))
        K := abs(src2 - out)/(abs(src2 - out) + stdev(src2,len)*len)
        result := out
    if type=="WRMA"
        //----
        alpha = 2/(len+1)
        p1 = zl ? len/4 : 1
        p2 = zl ? len/4 : len/2
        //----
        a = 0.0
        b = 0.0
        A = 0.0
        B = 0.0
        a := nz(a[1]) + alpha*nz(A[1])
        b := nz(b[1]) + alpha*nz(B[1])
        y = ema(a + b,p1)
        A := src - y
        B := src - ema(y,p2)
        result := y
        //----
    if type=="RMA"
        ma = sma(src,len*3) + sma(src,len*2) - sma(src,len)
        result := ma
    if type=="RAF"
        altma = 0.0
        AR = 2*(highest(len) - lowest(len))
        BR = 2*(highest(len*2) - lowest(len*2))
        k1 = (1 - AR)/AR
        k2 = (1 - BR)/BR
        //
        alpha = k2/k1
        R1 = sqrt(highest(len))/4 * ((alpha - 1)/alpha) * (k2/(k2 + 1))
        R2 = sqrt(highest(len*2))/4 * (alpha - 1) * (k1/(k1 + 1))
        Factor = R2/R1
        //
        AltK = fixnan(pow(Factor >= 1 ? 1 : Factor,sqrt(len)))*(1/len)
        altma := AltK*src+(1-AltK)*nz(altma[1],src)
        result := altma
    if type=="GF"
        ////////////////////////////////////////////////////////////////
        //Coefficients Table :
        //
        //MA : beta = 2/gamma = 0.5
        //EMA : beta = 3/gamma = 0.4
        //HMA = beta = 4/gamma = 0.85
        //LSMA : beta = 3.5/gamma = 0.9
        //QLSMA : beta = 5.25/gamma = 1
        //JMA : beta = pow*2/gamma = 0.5
        //3 Poles Butterworth Filter : beta = 5.5/gamma = 0.5/zeta = 0
        //
        ////////////////////////////////////////////////////////////////
        b = 0.0
        d = 0.0
        p = len/beta
        a = src - nz(b[p],src)
        b := nz(b[1],src) + a/p*gamma
        c = b - nz(d[p],b)
        d := nz(d[1],src) + (zeta*a+(1-zeta)*c)/p*gamma
        result := d
    if type=="A2RMA"
        er = abs(change(src,len))/sum(abs(change(src)),len)
        //----
        ma = 0.
        d = cum(abs(src - nz(ma[1],src)))/bar_index * gamma
        ma := ama(er,ama(er,src > nz(ma[1],src) + d ? src + d : src < nz(ma[1],src) - d ? src - d : nz(ma[1],src)))
        //----
        result := ma
    if type=="EDSMA"

        zeros = src - nz(src[2])
        avgZeros = (zeros + zeros[1]) / 2

        // Ehlers Super Smoother Filter
        ssf = ssfPoles == 2
             ? get2PoleSSF(avgZeros, ssfLength)
             : get3PoleSSF(avgZeros, ssfLength)

        // Rescale filter in terms of Standard Deviations
        stdev = stdev(ssf, len)
        scaledFilter = stdev != 0
             ? ssf / stdev
             : 0

        alpha = 5 * abs(scaledFilter) / len

        edsma = 0.0
        edsma := alpha * src + (1 - alpha) * nz(edsma[1])
        result :=  edsma
    result

//---parameters

cHigh = ma(Mode,high, PriceSmoothing)
cLow = ma(Mode,low, PriceSmoothing)
cOpen = ma(Mode,open, PriceSmoothing)
cClose = ma(Mode,close, PriceSmoothing)
pClose = cClose[1]

trueRange = max(cHigh, cClose) - min(cLow, pClose)
rrange = cHigh - cLow

vqi = 0.0
vqi := rrange != 0 and trueRange != 0 ?
   ((cClose - pClose) / trueRange + (cClose - cOpen) / rrange) * 0.5 : 0  //vqi[1]

vqi_abs = abs(vqi) * (cClose - pClose + cClose - cOpen) * 0.5
//sumVqi = vqi_abs //v1.0
sumVqi = abs(vqi_abs) > 1 ? vqi_abs : abs(vqi_abs) * 10 > 1 ? vqi_abs * 10 : vqi_abs


//plot(sumVqi, color=secolor, title="VQI", linewidth=2)
hline(0, title = "Zero", color=color.white, linestyle=hline.style_dotted, linewidth=1)
hline(1.64, title = "90% Line - Threshold 1", color=color.black, linestyle=hline.style_dotted, linewidth=1)
hline(-1.64, title = "90% Line - Threshold 1", color=color.black, linestyle=hline.style_dotted, linewidth=1)
hline(1.96, title = "95% Line - Threshold 2", color=color.black, linestyle=hline.style_dotted, linewidth=1)
hline(-1.96, title = "95% Line - Threshold 2", color=color.black, linestyle=hline.style_dotted, linewidth=1)
hline(2.58, title = "99% Line - Threshold 3", color=color.black, linestyle=hline.style_dotted, linewidth=1)
hline(-2.58, title = "99% Line - Threshold 3", color=color.black, linestyle=hline.style_dotted, linewidth=1)

///// Z SCORE CALCULATION


VQI = sumVqi
xStdDev = stdev(VQI, zlength)
xMA = sma(VQI, zlength)
z2=(VQI-xMA)/xStdDev

PAL = (z2 > 0)
PAS = (z2 < 0)

chgPAL = PAL and not PAL[1]
chgPAS = PAS and not PAS[1]

secolor = z2 > (vq0_mid + vq0_th) and z2 < (vq0_mid + vq0_th2) ? color.yellow : z2 > (vq0_mid + vq0_th2) and z2 < (vq0_mid + vq0_th3) ? color.orange : z2 > (vq0_mid + vq0_th3) ? color.green : z2 < (vq0_mid - vq0_th) and z2 > (vq0_mid - vq0_th2) ? color.yellow : z2 < (vq0_mid - vq0_th2) and z2 > (vq0_mid - vq0_th3) ? color.orange : z2 < (vq0_mid - vq0_th3) ? color.red : color.gray

plot(z2, title = "Z Score ATR", color=secolor,style=plot.style_area, transp=0)

//bgcolor(chgPAL ? color.green : chgPAS ? color.red : na, transp=80, title="Change in Price Action")
//plotshape(PAL, title="Price Action Long", location=location.bottom, style=shape.square, size=size.auto, color=color.green, transp=20)
//plotshape(PAS, title="Price Action Short", location=location.bottom, style=shape.square, size=size.auto, color=color.red, transp=20)
Volatility Qaulity Zero Line attempts to keep a trader out of ranging markets, but the original calculation on TradingView had to be adjusted for each instrument. To avoid this issue, I have applied a z-score calculation to the VQZL so the result is standardized for all instruments. A Z-Score is simply a value's relationship to the mean (average) of a group of values, measured in terms of standard deviations from the mean.
This calculation allows us to compare current volatility to the mean (moving average) of the population (Z-Length). The closer the VQZL Z-Score is to the mean, the closer it will be to the Zero Line and therefore price is likely consolidating and choppy. The farther VQZL Z-Score is from the mean, the more likely price is trending.
The MA Mode determines the Moving Average used to calculate VQZL itself. The Z-Score is ALWAYS calculated with a simple moving average (as that is the standard calculation for Z-Score).
The Threshold Levels are the levels at which VQZL Z-Score will change from gray to yellow, orange, green ( bullish ), or red ( bearish ). These levels can be adjusted but you should adjust the Threshold Lines as well (in the style section), so they line up with your adjusted values.
Statistically speaking, confidence levels in relation to Z-Score are noted below. The built in Threshold Levels are the positive and negative values for 90%, 95%, and 99%. This would indicate when volatility is greater than these values they are out of the ordinary from the standard range. You may wish to adjust these levels for VQZL Z-Score to be more responsive to your trading need
80% :: 1.28
85% :: 1.44
90% :: 1.64
95% :: 1.96
99% :: 2.58
As always, trade at your own risk.
VQZL Created by Investo And Adapted From @sarangab
Multiple MA Options Credits to @Fractured
Bits and Pieces from @AlexGrover and @Montyjus
Re: Already Converted TradingView Indicators to MT4 Indicators
79what a pity, worse that I don't have any additional information besides what was inside the trading view itself. what interested me was the proposal of VQZL + Z Score.mrtools wrote: Tue Jun 07, 2022 12:57 am Can't find anything how they made it so smooth, made a version but it's not close to the one depicted.
Re: Already Converted TradingView Indicators to MT4 Indicators
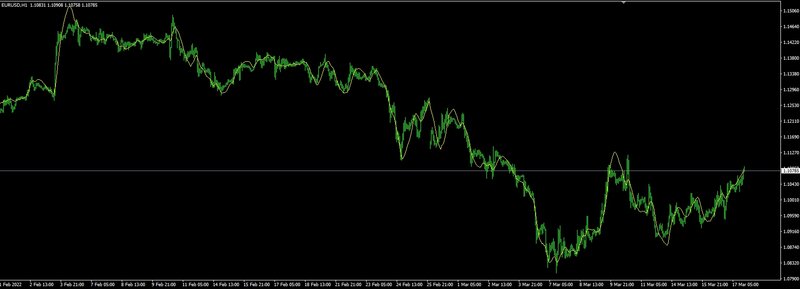
80hello everyone again, how are you? In my research, I came across a very interesting topic about the "Holy Grail" MA.
@Umberleigh suggested the MA Cora Wave. which I think is very interesting. I wanted to match her with Renko or HA. I put some crosses with the Fibo numbers and I had a good first impression.
OBS: I promise not to ask for conversion of indicators in the next few days, lol
@Umberleigh suggested the MA Cora Wave. which I think is very interesting. I wanted to match her with Renko or HA. I put some crosses with the Fibo numbers and I had a good first impression.
OBS: I promise not to ask for conversion of indicators in the next few days, lol
Code: Select all
//@version=4
// This source code is subject to the terms of the Mozilla Public License 2.0 at https://mozilla.org/MPL/2.0/
// © RedKTrader

study("Comp_Ratio_MA", shorttitle = "CoRa Wave", overlay = true, resolution ="")

// ======================================================================
// Compound Ratio Weight MA function
// Compound Ratio Weight is where the weight increases in a "logarithmicly linear" way (i.e., linear when plotted on a log chart) - similar to compound ratio
// the "step ratio" between weights is consistent - that's not the case with linear-weight moving average (WMA), or EMA
// another advantage is we can significantly reduce the "tail weight" - which is "relatively" large in other MAs and contributes to lag
//
// Compound Weight ratio     r = (A/P)^1/t - 1
// Weight at time t         A = P(1 + r)^t
//                            = Start_val * (1 + r) ^ index
// Note: index is 0 at the furthest point back -- num periods = length -1
//
f_adj_crwma(source, length, Start_Wt, r_multi) =>
    numerator = 0.0, denom = 0.0, c_weight = 0.0
    //Start_Wt = 1.0    // Start Wight is an input in this version - can also be set to a basic value here.
    End_Wt = length     // use length as initial End Weight to calculate base "r"
    r = pow((End_Wt / Start_Wt),(1 / (length - 1))) - 1
    base = 1 + r * r_multi
    for i = 0 to length -1
        c_weight    := Start_Wt * pow(base,(length - i))
        numerator   := numerator + source[i] * c_weight
        denom       := denom + c_weight
    numerator / denom
// ====================================================================== ==

data        = input(title = "Source",                 type = input.source,      defval = hlc3)
length      = input(title = "length",                 type = input.integer,     defval = 20,  minval = 1)
r_multi     = input(title = "Comp Ratio Multiplier",  type = input.float,       defval = 2.0, minval = 0, step = .1)
smooth      = input(title = "Auto Smoothing",         type = input.bool,        defval = true,                    group = "Smoothing")
man_smooth  = input(title = "Manual Smoothing",       type = input.integer,     defval = 1, minval = 1, step = 1, group = "Smoothing")

s           = smooth ? max(round(sqrt(length)),1) : man_smooth
cora_raw    = f_adj_crwma(data, length, 0.01, r_multi)
cora_wave   = wma(cora_raw, s)

c_up        = color.new(color.aqua, 0)
c_dn        = color.new(#FF9800   , 0)
cora_up     = cora_wave > cora_wave[1]
plot(cora_wave, title="Adjustible CoRa_Wave", color = cora_up ? c_up : c_dn, linewidth = 3)