Re: 👨🔬 Cagliostro's MT5 Laboratory
292Both versions for MT4 and MT5 available:
Big thanks to Cagliostro for his white paper and Pelle for the MT5 version.
- These users thanked the author Jimmy for the post (total 5):
- Cagliostro, Abdi, stereotomy, alexm, RodrigoRT7

Re: 👨🔬 Cagliostro's MT5 Laboratory
293Honestly, I never tire of seeing all the advancements you're proposing. I think seeking out these kinds of options clearly sets you apart from the rest. That VCD shows some incredible reversals, even in just one minute! Is the moment to see it live getting closer? Your suggestion to apply it to the RSI makes a lot of sense and seems very worthwhile. Cheers!Cagliostro wrote: Wed Mar 11, 2026 12:29 am VECTOR CONSENSUS DIVERGENCE (VCD)
A new slope-based divergence concept under testing in the latest version of The Oracle
We are currently testing a new concept in the latest version of The Oracle called VCD = Vector Consensus Divergence.
image_2026-03-10_135629988.png
In short, VCD is an attempt to rethink classical divergence in a more structural way.
Instead of comparing:VCD compares:
- price pivots
- vs a single oscillator pivot
So rather than asking whether one oscillator confirmed the last pivot, the model asks whether price is still extending while the underlying directional consensus is already deteriorating.
- the slope of price
- against the slope of internal consensus
This is interesting because classical divergence is structurally tied to pivot confirmation, which always requires future bars.
That usually means a trade-off between:VCD tries to approach the same problem using closed-bar slope analysis, which is more causal and less dependent on discretionary pivot detection. To be clear, we do not view VCD as a magical reversal predictor.
- more confirmation = more lag
- less confirmation = more repaint risk
A better description would be:
an early warning of trend fatigue / consensus erosion.
There is a substantial amount of scientific and quantitative research behind this concept, and for anyone interested in the theoretical side, a whitepaper is attached below for deeper reading. At the moment this is only being tested in the newest Oracle build.
Question for you guys:
Would there be interest in exploring the same VCD logic on more standard tools as well, such as RSI, MACD, CCI, or Stochastic?
For example, one possible extension would be to apply the same logic to a multi-period RSI stack rather than a single RSI line:
RSI(5), RSI(14), RSI(21), RSI(34)
In that case, divergence would no longer mean simply:
"price makes a higher high while RSI makes a lower high"
It could instead mean:
"price is still extending, while the internal RSI slope consensus is already weakening across multiple speeds"
That would make the concept more structural and less dependent on a single lookback setting.
If there is interest, we can share more charts and research notes.
+C+
- These users thanked the author ismasevi23 for the post:
- Cagliostro
Re: 👨🔬 Cagliostro's MT5 Laboratory
294Wishing you all a relaxing weekend, with some hopefully interesting updates of what is happening inside the Lab.
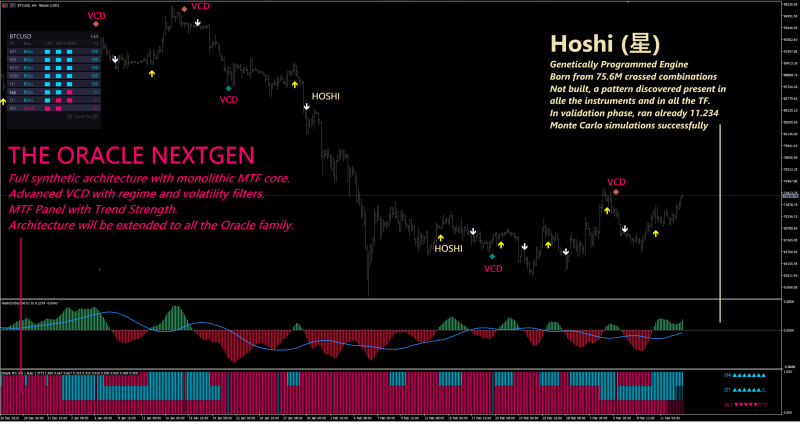
The Oracle: There are still some very insidious little bugs living inside the thousands of lines of oracle but the next generation is almost here. This is a big thing, not only as it costed almost a one full year of work, but as it will be like independence day from the brokers' bad data (read: manipulation), with full advanced VCD and an MTF panel for real time analysis.
Hoshi (星): this started as a research experiment. The idea was to use genetic programming and launch several probes into years of financial data across 21 instruments — FX, metals, indices, crypto — to see if unknown mathematical relationships existed in candle morphology. I found more than a dozen candidates. After systematic testing across all markets and timeframes, Hoshi emerged as a candle conviction algorithm. Since every indicator is ultimately derived from price, it was no surprise that Hoshi shows zero-lag conviction patterns present in any chart.
The Oracle: There are still some very insidious little bugs living inside the thousands of lines of oracle but the next generation is almost here. This is a big thing, not only as it costed almost a one full year of work, but as it will be like independence day from the brokers' bad data (read: manipulation), with full advanced VCD and an MTF panel for real time analysis.
Hoshi (星): this started as a research experiment. The idea was to use genetic programming and launch several probes into years of financial data across 21 instruments — FX, metals, indices, crypto — to see if unknown mathematical relationships existed in candle morphology. I found more than a dozen candidates. After systematic testing across all markets and timeframes, Hoshi emerged as a candle conviction algorithm. Since every indicator is ultimately derived from price, it was no surprise that Hoshi shows zero-lag conviction patterns present in any chart.
- These users thanked the author Cagliostro for the post (total 20):
- mazibee, BeatlemaniaSA, WN25, Nabs, JimmyG4444, eduarescobar, forexjoe85, xmrc, ricosuaveiii, Abdi, Shelwin1, TriThep, Jimmy, ismasevi23, specialkey, Dimkin, LAMA, victortrend, Lucas, Shink
"I conjure from shadows and shape fortunes from the unseen. The treasure lies hidden in plain sight, beneath the sunlight." - Cagliostro
Re: 👨🔬 Cagliostro's MT5 Laboratory
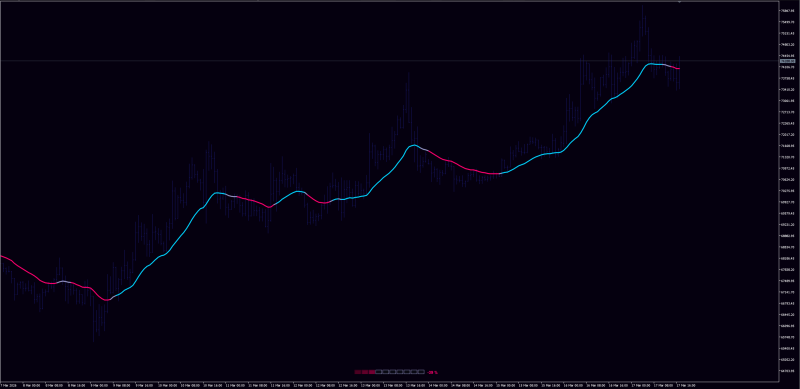
295ADAPTIVE KALMAN FILTER
Origin: post1295580938.html#p1295580938
An interesting story - I was in the middle of a huge testing of all the best trend indicator codes I know, when @SonOfTheLivermore shared this persistent version of the Kalman Trend by Zeiierman, a well known pinescript coder. Unusual code, with some strange (weird) math that I've found while converting it.
I respected the original code without "fixing" it and put in on a chart to check if visually the conversion was aligned with the original TV script. It was ok so shared it, but it looked good, too good on chart, so added it to the list of the tested indicators.
The test ended few hours ago.
Contestants:
• McGinley ATR Band (proprietary)
• SuperTrend
• Kalman Trend
• ATR Stepped PDFMA
• Meridian Trend (proprietary)
• Meridian F3 (proprietary)
• HA Smoothed
• Parabolic Sar
• Half Trend
• SSL Channel
• Magic Trend
• Adaptive Kalman Filter (this guy)
Methodology
• OOS walk-forward: 5 folds, 10% embargo between IS/OOS splits
• Data: Tickstory M1 bars, 2021–2026, 96.6M rows across 66 symbols (proprietary synthetic library)
• Delta = average improvement of filtered vs unfiltered direction across 5/10/20/40 bar horizons
• All indicators tested with default/recommended parameters — no curve-fitting
• Universe: 28 FX pairs, 12 indices, 4 metals, 3 energy, 2 crypto, 10 equities
• Asset class buckets use natural timeframes: FX on M5/M15, Indices/Metals/Equities on H1
Goals
• Validate Meridian Trend as the best universal trend indicator core
• Find the best trend indicator per asset (without curve fitting)
Results:
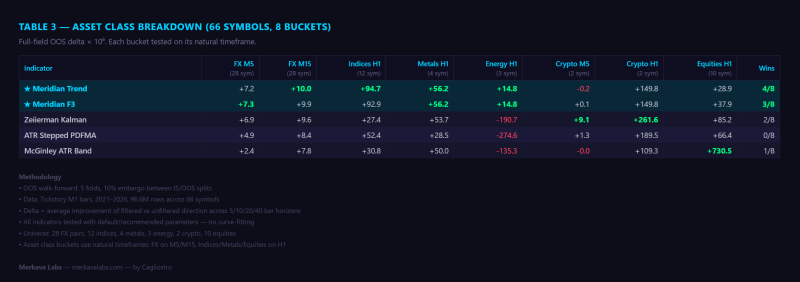
• The two meridian engines resulted the best overall trend indicators (so, finally we've got a new trend engine backed by strong math and testing).
• Surprisingly we have this Adaptive Kalman Filter (Zeiierman Kalman) scoring an excellent third place with absolute dominance over the crypto space on any TF. It looked good, did not realize so good.
• Below you can find a summary picture with the most relevant results.
Origin: post1295580938.html#p1295580938
An interesting story - I was in the middle of a huge testing of all the best trend indicator codes I know, when @SonOfTheLivermore shared this persistent version of the Kalman Trend by Zeiierman, a well known pinescript coder. Unusual code, with some strange (weird) math that I've found while converting it.
I respected the original code without "fixing" it and put in on a chart to check if visually the conversion was aligned with the original TV script. It was ok so shared it, but it looked good, too good on chart, so added it to the list of the tested indicators.
The test ended few hours ago.
Contestants:
• McGinley ATR Band (proprietary)
• SuperTrend
• Kalman Trend
• ATR Stepped PDFMA
• Meridian Trend (proprietary)
• Meridian F3 (proprietary)
• HA Smoothed
• Parabolic Sar
• Half Trend
• SSL Channel
• Magic Trend
• Adaptive Kalman Filter (this guy)
Methodology
• OOS walk-forward: 5 folds, 10% embargo between IS/OOS splits
• Data: Tickstory M1 bars, 2021–2026, 96.6M rows across 66 symbols (proprietary synthetic library)
• Delta = average improvement of filtered vs unfiltered direction across 5/10/20/40 bar horizons
• All indicators tested with default/recommended parameters — no curve-fitting
• Universe: 28 FX pairs, 12 indices, 4 metals, 3 energy, 2 crypto, 10 equities
• Asset class buckets use natural timeframes: FX on M5/M15, Indices/Metals/Equities on H1
Goals
• Validate Meridian Trend as the best universal trend indicator core
• Find the best trend indicator per asset (without curve fitting)
Results:
• The two meridian engines resulted the best overall trend indicators (so, finally we've got a new trend engine backed by strong math and testing).
• Surprisingly we have this Adaptive Kalman Filter (Zeiierman Kalman) scoring an excellent third place with absolute dominance over the crypto space on any TF. It looked good, did not realize so good.
• Below you can find a summary picture with the most relevant results.
- These users thanked the author Cagliostro for the post (total 14):
- anubis19, BeatlemaniaSA, eduarescobar, RodrigoRT7, WN25, Abdi, ricosuaveiii, Nabs, chris006, specialkey, SonOfTheLivermore, LAMA, Ricstar_8, Shink
"I conjure from shadows and shape fortunes from the unseen. The treasure lies hidden in plain sight, beneath the sunlight." - Cagliostro
Re: 👨🔬 Cagliostro's MT5 Laboratory
296@kvak I believe our friend Cagilostro was successful. I also tried converting to MT4, but the result so far is far from what TradingView shows. I'm still trying to convert to MT4 tooCagliostro wrote: Wed Mar 18, 2026 3:35 am ADAPTIVE KALMAN FILTER
image_2026-03-17_154958918.png
Origin: post1295580938.html#p1295580938
An interesting story - I was in the middle of a huge testing of all the best trend indicator codes I know, when @SonOfTheLivermore shared this persistent version of the Kalman Trend by Zeiierman, a well known pinescript coder. Unusual code, with some strange (weird) math that I've found while converting it.
I respected the original code without "fixing" it and put in on a chart to check if visually the conversion was aligned with the original TV script. It was ok so shared it, but it looked good, too good on chart, so added it to the list of the tested indicators.
The test ended few hours ago.
Contestants:
• McGinley ATR Band (proprietary)
• SuperTrend
• Kalman Trend
• ATR Stepped PDFMA
• Meridian Trend (proprietary)
• Meridian F3 (proprietary)
• HA Smoothed
• Parabolic Sar
• Half Trend
• SSL Channel
• Magic Trend
• Adaptive Kalman Filter (this guy)
Methodology
• OOS walk-forward: 5 folds, 10% embargo between IS/OOS splits
• Data: Tickstory M1 bars, 2021–2026, 96.6M rows across 66 symbols (proprietary synthetic library)
• Delta = average improvement of filtered vs unfiltered direction across 5/10/20/40 bar horizons
• All indicators tested with default/recommended parameters — no curve-fitting
• Universe: 28 FX pairs, 12 indices, 4 metals, 3 energy, 2 crypto, 10 equities
• Asset class buckets use natural timeframes: FX on M5/M15, Indices/Metals/Equities on H1
Goals
• Validate Meridian Trend as the best universal trend indicator core
• Find the best trend indicator per asset (without curve fitting)
Results:
• The two meridian engines resulted the best overall trend indicators (so, finally we've got a new trend engine backed by strong math and testing).
• Surprisingly we have this Adaptive Kalman Filter (Zeiierman Kalman) scoring an excellent third place with absolute dominance over the crypto space on any TF. It looked good, did not realize so good.
• Below you can find a summary picture with the most relevant results.
image_2026-03-17_155530115.png

Re: 👨🔬 Cagliostro's MT5 Laboratory
297MT4 > post1295581038.html#p1295581038RodrigoRT7 wrote: Wed Mar 18, 2026 9:22 am @kvak I believe our friend Cagilostro was successful. I also tried converting to MT4, but the result so far is far from what TradingView shows. I'm still trying to convert to MT4 too
The math is weird, that's why it's not an easy conversion.
- These users thanked the author Cagliostro for the post (total 2):
- WN25, RodrigoRT7
"I conjure from shadows and shape fortunes from the unseen. The treasure lies hidden in plain sight, beneath the sunlight." - Cagliostro
Re: 👨🔬 Cagliostro's MT5 Laboratory
298Hi Cagliostro, if you don't mind, when you have time away from your hectic schedule, could you explain the highlighted sections from the test results image?

Beatle

Millionaire Maker - “Amateurs chase. Professionals wait. Legends wait with a plan.”
BEATS V5 - "Enjoy The Quiet Between Trades”
Improve Your Trading Psychology - No fear, no doubt
Ultimate Risk Management - Maximize Your Trades
Supply and Demand Course - Learn Supply and Demand
Believe That You Can - Believe That You Can
BEATS V5 - "Enjoy The Quiet Between Trades”
Improve Your Trading Psychology - No fear, no doubt
Ultimate Risk Management - Maximize Your Trades
Supply and Demand Course - Learn Supply and Demand
Believe That You Can - Believe That You Can
Re: 👨🔬 Cagliostro's MT5 Laboratory
299Why Zeiierman Kalman crashes on Energy but explodes on Crypto
Hi Beatle, great question — and it goes deeper than it looks.
We ran a full OOS walk-forward test: 5 folds, 10% embargo, 66 symbols, 96.6M M1 bars (2021–2026), all indicators on default parameters, zero curve-fitting. Here's what the per-symbol H1 breakdown reveals.
It's the asset class, not the indicator.
Crypto (BTC, ETH) on H1 is strongly directional — trends last 20–50+ bars and the volatility carries. Zeiierman's slow Kalman smoothing locks onto these long moves perfectly:
The only "survivors" on Gas are indicators with 99-100% keep ratio — they survive by doing nothing.
So why does Meridian stay positive on Energy while Zeiierman doesn't?
Brent is the differentiator. On Brent H1:
Result:
Zeiierman Kalman is #3 overall in our 11-indicator showdown, #2 on FX H1 (+7.12 × 10⁻⁶), almost same results as Meridian, and #2 on Metals H1. Its weakness is concentrated in Energy — which is a structurally mean-reverting asset class on H1 timeframes. That's not a Zeiierman bug, it's an asset class characteristic that hurts every trend filter.
If want to trade FX, Crypto, Indices, or Metals — Zeiierman is a very strong filter. If you're on Energy, you'd need either a mean-reversion approach or an indicator that barely filters (like SuperTrend at 97% keep ratio).
+C+
Hi Beatle, great question — and it goes deeper than it looks.
We ran a full OOS walk-forward test: 5 folds, 10% embargo, 66 symbols, 96.6M M1 bars (2021–2026), all indicators on default parameters, zero curve-fitting. Here's what the per-symbol H1 breakdown reveals.
It's the asset class, not the indicator.
Crypto (BTC, ETH) on H1 is strongly directional — trends last 20–50+ bars and the volatility carries. Zeiierman's slow Kalman smoothing locks onto these long moves perfectly:
- BTCUSD H1: +174.5 × 10⁻⁶
- ETHUSD H1: +182.5 × 10⁻⁶
- Brent is moderately trendable on H1
- Natural Gas is violently mean-reverting — the worst symbol in the entire 66-symbol universe for trend followers
- Light Crude sits in between
Code: Select all
GASCMDUSD H1 — All indicators ranked:
─────────────────────────────────────────────
Parabolic SAR        	 +34.5 × 10⁻⁶  (keep 99% = barely filters)
SSL Channel         		 +0.0          (keep 100% = does nothing)
Magic Trend           	 +0.0          (keep 100% = does nothing)
Half Trend             	 -5.5
SuperTrend           	 -33.6
HA Smoothed           	 -89.2
Zeiierman Kalman    	 -161.0
ATR Stepped PDFMA    -217.2
Meridian Trend      	 -289.2
Kalman Trend         	 -1207.0     (keep 60% = most aggressive → worst loss)
So why does Meridian stay positive on Energy while Zeiierman doesn't?
Brent is the differentiator. On Brent H1:
- Meridian Trend: +56.0 × 10⁻⁶ (strong positive)
- Zeiierman Kalman: -21.6 × 10⁻⁶ (negative)
Result:
- Meridian wins big on Brent, limits damage on Gas/Light → net positive on Energy
- Zeiierman loses on all three Energy symbols → deep negative
Zeiierman Kalman is #3 overall in our 11-indicator showdown, #2 on FX H1 (+7.12 × 10⁻⁶), almost same results as Meridian, and #2 on Metals H1. Its weakness is concentrated in Energy — which is a structurally mean-reverting asset class on H1 timeframes. That's not a Zeiierman bug, it's an asset class characteristic that hurts every trend filter.
If want to trade FX, Crypto, Indices, or Metals — Zeiierman is a very strong filter. If you're on Energy, you'd need either a mean-reversion approach or an indicator that barely filters (like SuperTrend at 97% keep ratio).
+C+
BeatlemaniaSA wrote: Wed Mar 18, 2026 4:58 pm Hi Cagliostro, if you don't mind, when you have time away from your hectic schedule, could you explain the highlighted sections from the test results image?
image_2026-03-17_155530115.png
Much appreciated.
Beatle
- These users thanked the author Cagliostro for the post (total 5):
- mazibee, chris006, ricosuaveiii, SonOfTheLivermore, RodrigoRT7
"I conjure from shadows and shape fortunes from the unseen. The treasure lies hidden in plain sight, beneath the sunlight." - Cagliostro
Re: 👨🔬 Cagliostro's MT5 Laboratory
300Thanks for the detailed and very informative explanation. You da man!Cagliostro wrote: Wed Mar 18, 2026 8:45 pm Why Zeiierman Kalman crashes on Energy but explodes on Crypto
Hi Beatle, great question — and it goes deeper than it looks.

- These users thanked the author BeatlemaniaSA for the post:
- Cagliostro
Millionaire Maker - “Amateurs chase. Professionals wait. Legends wait with a plan.”
BEATS V5 - "Enjoy The Quiet Between Trades”
Improve Your Trading Psychology - No fear, no doubt
Ultimate Risk Management - Maximize Your Trades
Supply and Demand Course - Learn Supply and Demand
Believe That You Can - Believe That You Can
BEATS V5 - "Enjoy The Quiet Between Trades”
Improve Your Trading Psychology - No fear, no doubt
Ultimate Risk Management - Maximize Your Trades
Supply and Demand Course - Learn Supply and Demand
Believe That You Can - Believe That You Can