thanksmrtools wrote: Sun May 28, 2017 12:54 am This is a fibo indicator done by (if my memory is right) Mladen, it has alerts on user adjustable levels cross/touch, and an option to fill the candle that has crossed/touched the levels.
Re: Fibonacci, Trendlines, Support Resistance & Pivot Point Indicators MT4
22Hi Mrtools,
Is it possible to have the 2 levels of fibo (fibo retracement) in this indicator Positive and negative?
Example +161.8, +261.8 and -161.8, -261.8
In the case would be plotted the 2 nivies always positive and negative.
The goal would be for example
Above +161.8 buy with Tp at +261.8 and SL at -161.8
Thank you,
Rogério
Re: Fibonacci, Trendlines, Support Resistance & Pivot Point Indicators MT4
23Did you try entering negative values in the FiboLevels parameter?borgesr wrote: Wed May 31, 2017 12:21 am Hi Mrtools,
Is it possible to have the 2 levels of fibo (fibo retracement) in this indicator Positive and negative?
Example +161.8, +261.8 and -161.8, -261.8
In the case would be plotted the 2 nivies always positive and negative.
The goal would be for example
Above +161.8 buy with Tp at +261.8 and SL at -161.8
Thank you,
Rogério
 Re: Fibonacci, Trendlines, Support Resistance & Pivot Point Indicators MT4
24
Thank you Maladen,
Working fine
Regards,
Rogério
Working fine
- 0
- 23.6
- 38.2
- 50
- 61.8
- 100
- 161.8
- 261.8
- -161.8
- -261.8
Regards,
Rogério
Re: Fibonacci, Trendlines, Support Resistance & Pivot Point Indicators MT4
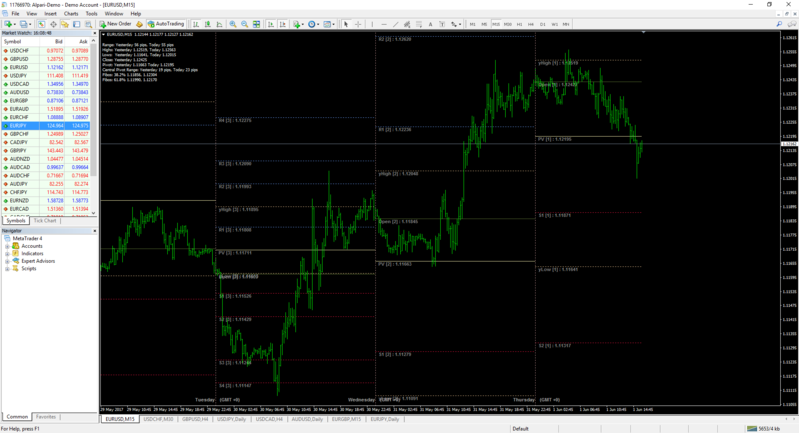
25Here are a few I have found useful.
Pivots - I combined standard, mid, fib and cam in a single indicator as an early project to learn MT4 on build 187.
The Cam historical versions I coded after reading about how to trade cam pivots.
I have not looked at these in a few years and hope to get back to trading these.
On GBPUSD and EURUSD 15 minute they have worked great in the past few weeks.
The rules I remember:
If price goes long first wait for return to Green and go short with target at Red.
If price goes short first wait for return to Red and go long with target at Green.
- Rating: 0.6%
Re: Fibonacci, Trendlines, Support Resistance & Pivot Point Indicators MT4
26Found this SDK Pivot Indicator from my mt4 collection folder.
- These users thanked the author matfx for the post (total 3):
- 太虚一毫, Jedidiah, RodrigoRT7
- Rating: 1.8%
Rule No.1: Never lose money. Rule No.2: Never forget rule No.1.
Re: Fibonacci, Trendlines, Support Resistance & Pivot Point Indicators MT4
27malden,
pls. check this indciator SR unable to see on screen . Just shown down only...
pls. check this indciator SR unable to see on screen . Just shown down only...
"There is NO GOD higher than TRUTH" - Mahatma Gandhi
Re: Fibonacci, Trendlines, Support Resistance & Pivot Point Indicators MT4
28Dear Mr Tools,mrtools wrote: Sun May 28, 2017 12:54 am This is a fibo indicator done by (if my memory is right) Mladen, it has alerts on user adjustable levels cross/touch, and an option to fill the candle that has crossed/touched the levels.
It’s me again. This is a great work, especially that we can add our own retrace levels but I’ve got a questions is there a possibility to change the function how the grid is being drawn.
So the base is not zigzag but what I mean is that the fibo grid is being drawn automatically on the chart from the highest high to lowest low (or inverse) of the candles actually display on the screen. In other words the indi base on the candles actually display on the screen find automatically highest high and lowest low candle and draw the grid and when a new candle is being drawn which exceeds the highest high or lowest low it redraws the grid. In short the indi find the low and high automatically and we don’t have to draw it manually and the range for searching are candles actually being displayed on the screen (it may change when you zoom in or out or change the timeframe).
If it is possible I would much appreciate Your help.
All the best!
Re: Fibonacci, Trendlines, Support Resistance & Pivot Point Indicators MT4
29Kyo, just to make sure I'm understanding correctly, your looking for the fibs to be using the highest high and lowest low of a period for their calculation, instead of zig zag.Kyo wrote: Sun Jun 04, 2017 7:23 am Dear Mr Tools,
It’s me again. This is a great work, especially that we can add our own retrace levels but I’ve got a questions is there a possibility to change the function how the grid is being drawn.
So the base is not zigzag but what I mean is that the fibo grid is being drawn automatically on the chart from the highest high to lowest low (or inverse) of the candles actually display on the screen. In other words the indi base on the candles actually display on the screen find automatically highest high and lowest low candle and draw the grid and when a new candle is being drawn which exceeds the highest high or lowest low it redraws the grid. In short the indi find the low and high automatically and we don’t have to draw it manually and the range for searching are candles actually being displayed on the screen (it may change when you zoom in or out or change the timeframe).
If it is possible I would much appreciate Your help.
All the best!
Shalom Shalom! 
Re: Fibonacci, Trendlines, Support Resistance & Pivot Point Indicators MT4
30Hellomrtools wrote: Sun Jun 04, 2017 9:20 pm Kyo, just to make sure I'm understanding correctly, your looking for the fibs to be using the highest high and lowest low of a period for their calculation, instead of zig zag.
Dear Mr Tools,
Thank You for Your fast response, Maybe I couldn’t explain it properly. I’m looking for something like in the attachment, but where you can enter your own fibo levels(ratios) and for example be able to choose the line style and width. And if it isn’t too much to ask it describe the price of the lines.
Thank You as always for your time


