Sorry to say, but it repaints. Watched in TV.pin12 wrote: Mon Feb 24, 2025 1:44 pm Hi
Could be created, based on the TradingView code, an indicator like this, which would be the same for Metatrader 4?
Re: Already Converted TradingView Indicators to MT4 Indicators
552Hi Mr Toolsmrtools wrote: Mon Feb 26, 2024 4:45 am Follow The Line with Regularized MA's + All Averages (Filters)
Would it be possible to add the bands.
I would like to see if it can serve some purpose such as a trailing stop line.
Thanks!
- These users thanked the author Tradehunter for the post:
- RodrigoRT7
Re: Already Converted TradingView Indicators to MT4 Indicators
553Follow The Line with Regularized MA's + All Averages (Filters) and added Visual BandsTradehunter wrote: Sat Mar 01, 2025 3:02 am Hi Mr Tools
Would it be possible to add the bands.
I would like to see if it can serve some purpose such as a trailing stop line.
Thanks!
Hello added the bands.
PS: For more information on this code, please see: Follow The Line + Angle Of Attack indicators.
- These users thanked the author mrtools for the post (total 16):
- Krunal Gajjar, Tradehunter, RodrigoRT7, Dragcaja, Jimmy, Akela, thomdel, Kayleb, Cagliostro, talaate, Mickey Abi, ujtrader, vinuthbn84, specialkey, trader2000, alllineid
Re: Already Converted TradingView Indicators to MT4 Indicators
554Hi guys i have post a request regarding converting Trading view indicator to Mt4 can i know why its removed ?
Re: Institutional OrderBlock Pressure Indicator
555It repaints indeed but it could be useful as you said. Although i can't change width.. and an on/off button would be great.naluvs01 wrote: Mon Jul 26, 2021 9:39 am I found one. I didn't test it to see if repaints or anything.
P.S. It does repaint, but can be used as a reference and it has alerts. However, I don't know how it compares to the other one. I'll do a comparison.
Can anyone do that please ?
Re: Already Converted TradingView Indicators to MT4 Indicators
556https://www.tradingview.com/script/hMct ... r-LuxAlgo/
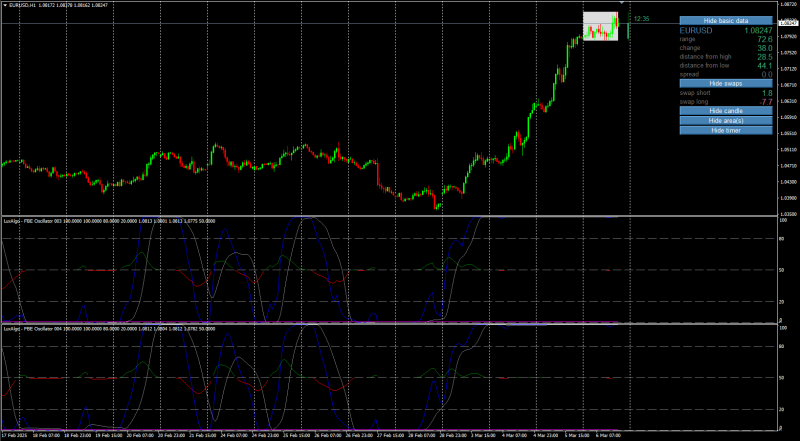 Trying to get this one of LuxAlgo to work. If somebody knows a way how to get the histogram working to oscillate around the 50 level, that would be great.
This version is as he has presented (from what I can tell):
And in this one I wanted to introduce a selection for price and MA:
The latter is slowly building, not sure if it is the way I loop through the bars or my computer is too busy atm. the MA Smoother option seems to improve things, but SuperSmoother and UltimateSmoother seem not suitable for this indie.
If one of the wizards can put the standard set of MA, that would be highly appreciated.
 Re: Already Converted TradingView Indicators to MT4 Indicators
557
Hi Previously i had post same as this help me to convert TradingView to Mt4 but it was deleted and no response from the admin
Im requesting it again
Trading view Link : https://www.tradingview.com/script/Nxez ... esistance/
Im requesting it again
Trading view Link : https://www.tradingview.com/script/Nxez ... esistance/
Re: Already Converted TradingView Indicators to MT4 Indicators
558
Atr stop loss finder Divergence and Envelopes
HI, i was wondering if it is possible to add divergence as in screeenshots to the atr stop loss finder, also i use envelopes with settings in the screenshot after atr stop loss finder hits divergence to wait for the price to touch the envelope then enter.
The problem is that this hard to spot with naked eye on the indicator so if there was a divergence added would be very accurate for reversal signals with ver tight stop loss.
And it would be great to add envelopes as well, and some kind of signal when envelope hits, but DIVERGENCEis most important.
Atr stop loss finder ATR length 2 ,EMA, ATR multiplier 1.5
Re: HSRL - Historical Support Resistance Lines
559please coders fix it, It doesn't work anymoreionone wrote: Wed May 18, 2022 6:36 pm converted from TradingView : HSRL - Historical Support Resistance Lines
might be usefull to ya
screenshot.211.jpg
Code: Select all
// This source code is subject to the terms of the Mozilla Public License 2.0 at https://mozilla.org/MPL/2.0/
// © spiritualhealer117

//@version=4
study("HSRL")
length = input(title="Length", type=input.integer, defval=150)
resistanceChange = (highest(close,length)-highest(close,length)[length])/highest(close,length)[length]
supportChange = (lowest(close,length)-lowest(close,length)[length])/lowest(close,length)[length]
HSRL = resistanceChange-supportChange

line1=plot(resistanceChange,color=color.green)
line2=plot(supportChange,color=color.red)
fill(line1,line2,color=resistanceChange>supportChange?(resistanceChange>0?color.new(color.green,50):color.new(color.red,50)):(resistanceChange>0?color.new(color.yellow,25):color.new(color.yellow,50)))
 Re: HSRL - Historical Support Resistance Lines
560
ionone wrote: Wed May 18, 2022 6:36 pm Converted from TradingView : HSRL - Historical Support Resistance Lines
Historical Support and Resistance Lines
Did this version, but not sure if it is the same as the original though.
What is the HSRL indicator?
HSRL serves as a metric to illustrate a the "evolution" of a chart's of support and resistance levels over time. It computes the percentage change in both lows and highs, subsequently visualizing these changes.
The HSRL is derived by subtracting the change in resistance from the change in support. This indicator can be useful for validating trends, with green indicating a strong bullish sentiment, yellow representing a moderately bullish outlook, and red signaling a bearish trend, characterized by declining resistance and support levels.
How is the HSRL indicator used?
The indicator assesses the strength of trends by monitoring variations in the highest highs (resistance) and lowest lows (support) over a specified period, which is set to
150 bars by default.
- If the change in resistance exceeds the change in support, the market could be considered bullish.
- If the change in support exceeds the change in resistance, the market could be considered bearish.
- The visual representation features two plotted lines:
- Yellow Line (Resistance) Measures upward trend strength.
- Red Line (Support) Measures downward trend strength.
- The indicator will find single-period Moving Averages of high and low prices. Temporary buffers are used to hold moving average values of high and low prices.
PS: Additionally, for Ionone (Jeff)'s latest version, please see here.
- These users thanked the author mrtools for the post (total 10):
- hassan5041, Jimmy, ionone, vvFish, Krunal Gajjar, RodrigoRT7, talaate, Steam1, alexm, macd & rsi