sure
Re: Already Converted TradingView Indicators to MT4 Indicators
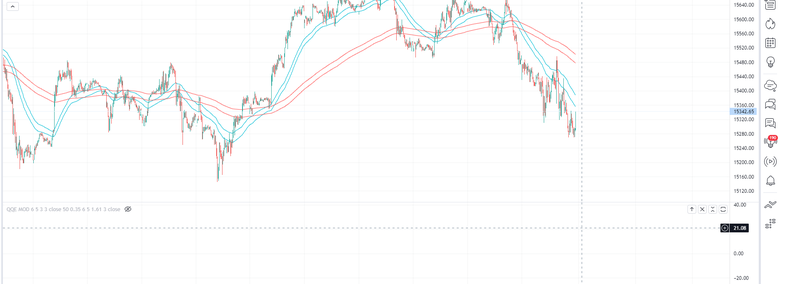
262how do you use it please ? it looks like a decent range filter
Scalping the Century TimeFrame since 1999
Re: Already Converted TradingView Indicators to MT4 Indicators
263I wanted to use it as a volatility indicator, so that's how I understood it. That a falling line coming out of the red zone and turning green can indicate a breakout from a correction.ionone wrote: Thu Mar 09, 2023 7:30 pm how do you use it please ? it looks like a decent range filter
Re: Already Converted TradingView Indicators to MT4 Indicators
264Maybe this version...
- These users thanked the author kvak for the post (total 5):
- 太虚一毫, pail1217, RodrigoRT7, Chickenspicy, saishala
Re: Already Converted TradingView Indicators to MT4 Indicators
265Yes, works perfectly now. Big thanks for fixing it!
Re: Already Converted TradingView Indicators to MT4 Indicators
266dear big coders, please convert this big tradingview opening weekly and daily gap indicator for mt4, thanks in advance.
https://www.tradingview.com/script/f0yu ... ptonnnite/
https://www.tradingview.com/script/f0yu ... ptonnnite/
- These users thanked the author menber100 for the post (total 2):
- RodrigoRT7, Akela
Re: Already Converted TradingView Indicators to MT4 Indicators
267Hi
Can You help me and :
_ convert to MT4
_ add SMMA
_ add MTF
_ add button ON / OFF
These are simple averages and the code is open source.
Thx and regards
Greg
Can You help me and :
_ convert to MT4
_ add SMMA
_ add MTF
_ add button ON / OFF
Code: Select all
indicator(title='Kanały średnich', overlay=true, timeframe="")

short = input(33, "Wartość short")
long = input(144, "Wartość long")

srednia(src, length, type) =>
    switch type
        "RMA" => ta.rma(src, length)
        "EMA" => ta.ema(src, length)
        "SMA" => ta.sma(src, length)
        "WMA" => ta.wma(src, length)
        "VWMA" => ta.vwma(src, length)

metoda = input.string(title = "Metoda liczenia średniej", defval = "RMA", options=["RMA", "EMA", "SMA", "WMA", "VWMA"])

shortl = srednia(low, short, metoda)
shorth = srednia(high, short, metoda)
longl = srednia(low, long, metoda)
longh = srednia(high, long, metoda)

plot(shortl, color=color.new(color.aqua, 0), linewidth=1, title="Short low")   // Low 33
plot(shorth, color=color.new(color.aqua, 0), linewidth=1, title="Short high")  // High 33
plot(longl, color=color.new(color.red, 0), linewidth=1, title="Long low")      // Low 144
plot(longh, color=color.new(color.red, 0), linewidth=1, title="Long high") // High 144Thx and regards
Greg
Re: Already Converted TradingView Indicators to MT4 Indicators
268hi sir
can you convert this tradingview indicator to mt4
3LS (TTF)
This indicator is a spin-off of the popular TMA Overlay indicator made by request of the original author that narrows down the scope to simply identifying a couple of key candlestick patterns - Engulfing candles and 3 Line Strikes.
In addition to being a far more tailored and purpose-specific indicator, we have also update the indicator code to the latest version of Pinescript and added some enhanced alerts.
Code: Select all
 // Based on the TMA Overlay by Arty
//
// This is a trimmed down version of the OG TMA Overlay with a focus on highlighting a couple specific candlestick patterns.
// This script is organized in a way that allows each pattern to be commented-out (disabled) or uncommented (enabled) pretty easily.
//
// The original request was for 3-Line-Strike only, so that is what will be enabled/uncommented by default,
// but the engulfing code will be left in as well so that it can be turned on easily if desired.
//
// TODO: Add in a trend filter based on the trend identification method Arty discusses in his video on this candle pattern.
//
// NOTE: As-written, the symbols and 'alert()' functions are subject to repainting (firing without a confirmed signal at bar close).
//       This was done deliberately as a way to give people early-warning on live charts to help give them time to prepare for an entry,
//       which can be especially significant when scalping on low timeframe (1-5m) charts.
//
//
//@version=5
indicator(title='3 Line Strike [TTF]', shorttitle='3LS [TTF]', overlay=true)

// Inputs
//
// ### 3 Line Strike
//
showBear3LS = input.bool(title='Show Bearish 3 Line Strike', defval=true, group='3 Line Strike', tooltip="The Bearish 3 Line Strike (3LS-Bear) is a candlestick pattern comprised of 3 bullish (green) candles, " +
         "followed by a bearish engulfing candle (see 'Big A$$ Candles' below).\n\n" +
         "This pattern tends to be best used as a signal of the end of a retracement period as part of a trend continuation strategy.\n\n" +
         "Default: Checked")
showBull3LS = input.bool(title='Show Bullish 3 Line Strike', defval=true, group='3 Line Strike', tooltip="The Bullish 3 Line Strike (3LS-Bull) is a candlestick pattern comprised of 3 bearish (red) candles, " +
         "followed by a bullish engulfing candle (see 'Big A$$ Candles' below).\n\n" +
         "This pattern tends to be best used as a signal of the end of a retracement period as part of a trend continuation strategy.\n\n" +
         "Default: Checked")
showMemeChars = input.bool(title="Plot 3 Line Strike meme symbols", defval=false, group="3 Line Strike", tooltip="If disabled (default), standard shapes will be plotted instead, which can then be further customized on the 'Styles' tab of the indicator settings.\n\n" +
         "If enabled, meme icons hand-selected by Arty himself (🍆 and 🍑) will be plotted for 3LS signals instead of the more typical shapes.\n\n" +
         "Default: Unchecked")
//
//### Engulfing Candles
//
showBearEngulfing= input.bool(title='Show Bearish Big A$$ Candles', defval=false, group='Big A$$ Candles', tooltip="Bearish 'Big A$$ Candles' are the same as Bearish Engulfing candles.")
showBullEngulfing= input.bool(title='Show Bullish Big A$$ Candles', defval=false, group='Big A$$ Candles', tooltip="Bullish 'Big A$$ Candles' are the same as Bullish Engulfing candles.")
//
//### Alerts
//
// This won't actually DO anything, just popping it to note the behavior of the "Any alert() function call" alert type
void = input.bool(title="The new 'Any alert() function call' (dynamic) alerts will be based on what signals are enabled in the indicator settings.", defval=true, tooltip="This does nothing - it's only here to clarify alert functionality.")
//
// End Inputs ###

// Function definitions...
//
// Derive candle "color".  For simplicity, I originally wanted to make this a true/false and have any true doji candles (where open and close are exactly the same)
// either inherit the previous value, or invalidate the setup (which was the original behavior), but that behavior wasn't working as expected.  So for now, we're
// going to do a hack and make this a numeric return instead, where...
//
// -1 -> Red/Bearish
//  0 -> Doji
// +1 -> Green/BUllish
//
getCandleColorIndex(barIndex) =>
    int ret = na
    if (close[barIndex] > open[barIndex])
        ret := 1
    else if (close[barIndex] < open[barIndex])
        ret := -1
    else
        ret := 0
    ret

//
// Check for engulfing candles
isEngulfing(checkBearish) =>
    // In an effort to try and make this a bit more consistent, we're going to calculate and compare the candle body sizes
    // to inform the engulfing or not decision, and only use the open vs close comparisons to identify the candle "color"
    ret = false
    sizePrevCandle = close[1] - open[1] // negative numbers = red, positive numbers = green, 0 = doji
    sizeCurrentCandle = close - open    // negative numbers = red, positive numbers = green, 0 = doji
    isCurrentLagerThanPrevious = (math.abs(sizeCurrentCandle) > math.abs(sizePrevCandle)) ? true : false
    // We now have the core info to evaluate engulfing candles
    switch checkBearish
        true =>
            // Check for bearish engulfing (green candle followed by a larger red candle)
            isGreenToRed = ((getCandleColorIndex(0) < 0) and (getCandleColorIndex(1) > 0)) ? true : false
            ret := (isCurrentLagerThanPrevious and isGreenToRed) ? true : false
        false =>
            // Check for bullish engulfing (red candle followed by a larger green candle)
            isRedToGreen = ((getCandleColorIndex(0) > 0) and (getCandleColorIndex(1) < 0)) ? true : false
            ret := (isCurrentLagerThanPrevious and isRedToGreen) ? true : false
        => ret := false // This should be impossible to trigger...
    ret
//
// Helper functions that wraps the isEngulfing above...
isBearishEngulfuing() =>
    ret = isEngulfing(true)
    ret
//
isBullishEngulfuing() =>
    ret = isEngulfing(false)
    ret
//
// Functions to check for 3 consecutive candles of one color, followed by an engulfing candle of the opposite color
//
// Bearish 3LS = 3 green candles immediately followed by a bearish engulfing candle
is3LSBear() =>
    ret = false
    is3LineSetup = ((getCandleColorIndex(1) > 0) and (getCandleColorIndex(2) > 0) and (getCandleColorIndex(3) > 0)) ? true : false
    ret := (is3LineSetup and isBearishEngulfuing()) ? true : false
    ret
//
// Bullish 3LS = 3 red candles immediately followed by a bullish engulfing candle
is3LSBull() =>
    ret = false
    is3LineSetup = ((getCandleColorIndex(1) < 0) and (getCandleColorIndex(2) < 0) and (getCandleColorIndex(3) < 0)) ? true : false
    ret := (is3LineSetup and isBullishEngulfuing()) ? true : false
    ret


// ### 3 Line Strike
is3LSBearSig = is3LSBear()
is3LSBullSig = is3LSBull()

// Meme plots for the 3LS signal
plotchar(showBull3LS and showMemeChars ? is3LSBullSig : na, char="🍆", color=color.rgb(0, 255, 0, 0), location=location.belowbar, size=size.tiny, text='3LS-Bull', title='3 Line Strike Up (Meme Icon)', editable=false)
plotchar(showBear3LS and showMemeChars ? is3LSBearSig : na, char="🍑", color=color.rgb(255, 0, 0, 0), location=location.abovebar, size=size.tiny, text='3LS-Bear', title='3 Line Strike Down (Meme Icon)', editable=false)
//
// Standard plots for the 3LS signal
plotshape(showBull3LS and not showMemeChars ? is3LSBullSig : na, style=shape.triangleup, color=color.rgb(0, 255, 0, 0), location=location.belowbar, size=size.small, text='3LS-Bull', title='3 Line Strike Up')
plotshape(showBear3LS and not showMemeChars ? is3LSBearSig : na, style=shape.triangledown, color=color.rgb(255, 0, 0, 0), location=location.abovebar, size=size.small, text='3LS-Bear', title='3 Line Strike Down')
//
// # Alerts
//
// Old-style Alert Conditions
alertcondition(showBull3LS and is3LSBullSig, title='Bullish 3 Line Strike', message='{{exchange}}:{{ticker}} {{interval}} - Bullish 3 Line Strike')
alertcondition(showBear3LS and is3LSBearSig, title='Bearish 3 Line Strike', message='{{exchange}}:{{ticker}} {{interval}} - Bearish 3 Line Strike')
//
// New-style alerts
if (showBull3LS and is3LSBullSig)
    m = syminfo.tickerid + ' ' + timeframe.period + ' - Bullish 3 Line Strike'
    alert(message=str.tostring(m), freq=alert.freq_once_per_bar_close)
if (showBear3LS and is3LSBearSig)
    m = syminfo.tickerid + ' ' + timeframe.period + ' - Bearish 3 Line Strike'
    alert(message=str.tostring(m), freq=alert.freq_once_per_bar_close)

// End ###

//### Engulfing Candles

//If current bar open is less than equal to the previous bar close AND current bar open is less than previous bar open AND current bar close is greater than previous bar open THEN True
isBullEngulfingSig = isBullishEngulfuing()
//If current bar open is greater than equal to previous bar close AND current bar open is greater than previous bar open AND current bar close is less than previous bar open THEN True
isBearEngulfingSig = isBearishEngulfuing()

//bullishEngulfing/isBearEngulfingSig return a value of 1 or 0; if 1 then plot on chart, if 0 then don't plot
plotshape(showBullEngulfing ? isBullEngulfingSig : na, style=shape.triangleup, location=location.belowbar, color=color.rgb(0, 255, 0, 0), size=size.tiny, title='Big A$$ Candle Up')
plotshape(showBearEngulfing ? isBearEngulfingSig : na, style=shape.triangledown, location=location.abovebar, color=color.rgb(255, 0, 0, 0), size=size.tiny, title='Big A$$ Candle Down')

// Alerts
//
// Old-style alert conditions...
alertcondition(showBullEngulfing and isBullEngulfingSig, title='Bullish Engulfing', message='{{exchange}}:{{ticker}} {{interval}} - Bullish candle engulfing previous candle')
alertcondition(showBearEngulfing and isBearEngulfingSig, title='Bearish Engulfing', message='{{exchange}}:{{ticker}} {{interval}} - Bearish candle engulfing previous candle')
//
// New-style alert() functions
// New-style alerts
if (showBullEngulfing and isBullEngulfingSig)
    m = syminfo.tickerid + ' ' + timeframe.period + ' - Bullish candle engulfing previous candle'
    alert(message=str.tostring(m), freq=alert.freq_once_per_bar_close)
if (showBearEngulfing and isBearEngulfingSig)
    m = syminfo.tickerid + ' ' + timeframe.period + ' - Bearish candle engulfing previous candle'
    alert(message=str.tostring(m), freq=alert.freq_once_per_bar_close)

// End ###
Re: Already Converted TradingView Indicators to MT4 Indicators
269hello friend Wael007, how are you? always put an image so that our programmer friends know what it is about, because sometimes we have some related indicatorwael007 wrote: Mon Mar 13, 2023 1:53 pm hi sir
can you convert this tradingview indicator to mt4
3LS (TTF)
This indicator is a spin-off of the popular TMA Overlay indicator made by request of the original author that narrows down the scope to simply identifying a couple of key candlestick patterns - Engulfing candles and 3 Line Strikes.
In addition to being a far more tailored and purpose-specific indicator, we have also update the indicator code to the latest version of Pinescript and added some enhanced alerts.
Code: Select all
 // Based on the TMA Overlay by Arty
//
// This is a trimmed down version of the OG TMA Overlay with a focus on highlighting a couple specific candlestick patterns.
// This script is organized in a way that allows each pattern to be commented-out (disabled) or uncommented (enabled) pretty easily.
//
// The original request was for 3-Line-Strike only, so that is what will be enabled/uncommented by default,
// but the engulfing code will be left in as well so that it can be turned on easily if desired.
//
// TODO: Add in a trend filter based on the trend identification method Arty discusses in his video on this candle pattern.
//
// NOTE: As-written, the symbols and 'alert()' functions are subject to repainting (firing without a confirmed signal at bar close).
//       This was done deliberately as a way to give people early-warning on live charts to help give them time to prepare for an entry,
//       which can be especially significant when scalping on low timeframe (1-5m) charts.
//
//
//@version=5
indicator(title='3 Line Strike [TTF]', shorttitle='3LS [TTF]', overlay=true)

// Inputs
//
// ### 3 Line Strike
//
showBear3LS = input.bool(title='Show Bearish 3 Line Strike', defval=true, group='3 Line Strike', tooltip="The Bearish 3 Line Strike (3LS-Bear) is a candlestick pattern comprised of 3 bullish (green) candles, " +
         "followed by a bearish engulfing candle (see 'Big A$$ Candles' below).\n\n" +
         "This pattern tends to be best used as a signal of the end of a retracement period as part of a trend continuation strategy.\n\n" +
         "Default: Checked")
showBull3LS = input.bool(title='Show Bullish 3 Line Strike', defval=true, group='3 Line Strike', tooltip="The Bullish 3 Line Strike (3LS-Bull) is a candlestick pattern comprised of 3 bearish (red) candles, " +
         "followed by a bullish engulfing candle (see 'Big A$$ Candles' below).\n\n" +
         "This pattern tends to be best used as a signal of the end of a retracement period as part of a trend continuation strategy.\n\n" +
         "Default: Checked")
showMemeChars = input.bool(title="Plot 3 Line Strike meme symbols", defval=false, group="3 Line Strike", tooltip="If disabled (default), standard shapes will be plotted instead, which can then be further customized on the 'Styles' tab of the indicator settings.\n\n" +
         "If enabled, meme icons hand-selected by Arty himself (🍆 and 🍑) will be plotted for 3LS signals instead of the more typical shapes.\n\n" +
         "Default: Unchecked")
//
//### Engulfing Candles
//
showBearEngulfing= input.bool(title='Show Bearish Big A$$ Candles', defval=false, group='Big A$$ Candles', tooltip="Bearish 'Big A$$ Candles' are the same as Bearish Engulfing candles.")
showBullEngulfing= input.bool(title='Show Bullish Big A$$ Candles', defval=false, group='Big A$$ Candles', tooltip="Bullish 'Big A$$ Candles' are the same as Bullish Engulfing candles.")
//
//### Alerts
//
// This won't actually DO anything, just popping it to note the behavior of the "Any alert() function call" alert type
void = input.bool(title="The new 'Any alert() function call' (dynamic) alerts will be based on what signals are enabled in the indicator settings.", defval=true, tooltip="This does nothing - it's only here to clarify alert functionality.")
//
// End Inputs ###

// Function definitions...
//
// Derive candle "color".  For simplicity, I originally wanted to make this a true/false and have any true doji candles (where open and close are exactly the same)
// either inherit the previous value, or invalidate the setup (which was the original behavior), but that behavior wasn't working as expected.  So for now, we're
// going to do a hack and make this a numeric return instead, where...
//
// -1 -> Red/Bearish
//  0 -> Doji
// +1 -> Green/BUllish
//
getCandleColorIndex(barIndex) =>
    int ret = na
    if (close[barIndex] > open[barIndex])
        ret := 1
    else if (close[barIndex] < open[barIndex])
        ret := -1
    else
        ret := 0
    ret

//
// Check for engulfing candles
isEngulfing(checkBearish) =>
    // In an effort to try and make this a bit more consistent, we're going to calculate and compare the candle body sizes
    // to inform the engulfing or not decision, and only use the open vs close comparisons to identify the candle "color"
    ret = false
    sizePrevCandle = close[1] - open[1] // negative numbers = red, positive numbers = green, 0 = doji
    sizeCurrentCandle = close - open    // negative numbers = red, positive numbers = green, 0 = doji
    isCurrentLagerThanPrevious = (math.abs(sizeCurrentCandle) > math.abs(sizePrevCandle)) ? true : false
    // We now have the core info to evaluate engulfing candles
    switch checkBearish
        true =>
            // Check for bearish engulfing (green candle followed by a larger red candle)
            isGreenToRed = ((getCandleColorIndex(0) < 0) and (getCandleColorIndex(1) > 0)) ? true : false
            ret := (isCurrentLagerThanPrevious and isGreenToRed) ? true : false
        false =>
            // Check for bullish engulfing (red candle followed by a larger green candle)
            isRedToGreen = ((getCandleColorIndex(0) > 0) and (getCandleColorIndex(1) < 0)) ? true : false
            ret := (isCurrentLagerThanPrevious and isRedToGreen) ? true : false
        => ret := false // This should be impossible to trigger...
    ret
//
// Helper functions that wraps the isEngulfing above...
isBearishEngulfuing() =>
    ret = isEngulfing(true)
    ret
//
isBullishEngulfuing() =>
    ret = isEngulfing(false)
    ret
//
// Functions to check for 3 consecutive candles of one color, followed by an engulfing candle of the opposite color
//
// Bearish 3LS = 3 green candles immediately followed by a bearish engulfing candle
is3LSBear() =>
    ret = false
    is3LineSetup = ((getCandleColorIndex(1) > 0) and (getCandleColorIndex(2) > 0) and (getCandleColorIndex(3) > 0)) ? true : false
    ret := (is3LineSetup and isBearishEngulfuing()) ? true : false
    ret
//
// Bullish 3LS = 3 red candles immediately followed by a bullish engulfing candle
is3LSBull() =>
    ret = false
    is3LineSetup = ((getCandleColorIndex(1) < 0) and (getCandleColorIndex(2) < 0) and (getCandleColorIndex(3) < 0)) ? true : false
    ret := (is3LineSetup and isBullishEngulfuing()) ? true : false
    ret


// ### 3 Line Strike
is3LSBearSig = is3LSBear()
is3LSBullSig = is3LSBull()

// Meme plots for the 3LS signal
plotchar(showBull3LS and showMemeChars ? is3LSBullSig : na, char="🍆", color=color.rgb(0, 255, 0, 0), location=location.belowbar, size=size.tiny, text='3LS-Bull', title='3 Line Strike Up (Meme Icon)', editable=false)
plotchar(showBear3LS and showMemeChars ? is3LSBearSig : na, char="🍑", color=color.rgb(255, 0, 0, 0), location=location.abovebar, size=size.tiny, text='3LS-Bear', title='3 Line Strike Down (Meme Icon)', editable=false)
//
// Standard plots for the 3LS signal
plotshape(showBull3LS and not showMemeChars ? is3LSBullSig : na, style=shape.triangleup, color=color.rgb(0, 255, 0, 0), location=location.belowbar, size=size.small, text='3LS-Bull', title='3 Line Strike Up')
plotshape(showBear3LS and not showMemeChars ? is3LSBearSig : na, style=shape.triangledown, color=color.rgb(255, 0, 0, 0), location=location.abovebar, size=size.small, text='3LS-Bear', title='3 Line Strike Down')
//
// # Alerts
//
// Old-style Alert Conditions
alertcondition(showBull3LS and is3LSBullSig, title='Bullish 3 Line Strike', message='{{exchange}}:{{ticker}} {{interval}} - Bullish 3 Line Strike')
alertcondition(showBear3LS and is3LSBearSig, title='Bearish 3 Line Strike', message='{{exchange}}:{{ticker}} {{interval}} - Bearish 3 Line Strike')
//
// New-style alerts
if (showBull3LS and is3LSBullSig)
    m = syminfo.tickerid + ' ' + timeframe.period + ' - Bullish 3 Line Strike'
    alert(message=str.tostring(m), freq=alert.freq_once_per_bar_close)
if (showBear3LS and is3LSBearSig)
    m = syminfo.tickerid + ' ' + timeframe.period + ' - Bearish 3 Line Strike'
    alert(message=str.tostring(m), freq=alert.freq_once_per_bar_close)

// End ###

//### Engulfing Candles

//If current bar open is less than equal to the previous bar close AND current bar open is less than previous bar open AND current bar close is greater than previous bar open THEN True
isBullEngulfingSig = isBullishEngulfuing()
//If current bar open is greater than equal to previous bar close AND current bar open is greater than previous bar open AND current bar close is less than previous bar open THEN True
isBearEngulfingSig = isBearishEngulfuing()

//bullishEngulfing/isBearEngulfingSig return a value of 1 or 0; if 1 then plot on chart, if 0 then don't plot
plotshape(showBullEngulfing ? isBullEngulfingSig : na, style=shape.triangleup, location=location.belowbar, color=color.rgb(0, 255, 0, 0), size=size.tiny, title='Big A$$ Candle Up')
plotshape(showBearEngulfing ? isBearEngulfingSig : na, style=shape.triangledown, location=location.abovebar, color=color.rgb(255, 0, 0, 0), size=size.tiny, title='Big A$$ Candle Down')

// Alerts
//
// Old-style alert conditions...
alertcondition(showBullEngulfing and isBullEngulfingSig, title='Bullish Engulfing', message='{{exchange}}:{{ticker}} {{interval}} - Bullish candle engulfing previous candle')
alertcondition(showBearEngulfing and isBearEngulfingSig, title='Bearish Engulfing', message='{{exchange}}:{{ticker}} {{interval}} - Bearish candle engulfing previous candle')
//
// New-style alert() functions
// New-style alerts
if (showBullEngulfing and isBullEngulfingSig)
    m = syminfo.tickerid + ' ' + timeframe.period + ' - Bullish candle engulfing previous candle'
    alert(message=str.tostring(m), freq=alert.freq_once_per_bar_close)
if (showBearEngulfing and isBearEngulfingSig)
    m = syminfo.tickerid + ' ' + timeframe.period + ' - Bearish candle engulfing previous candle'
    alert(message=str.tostring(m), freq=alert.freq_once_per_bar_close)

// End ###
Re: Already Converted TradingView Indicators to MT4 Indicators
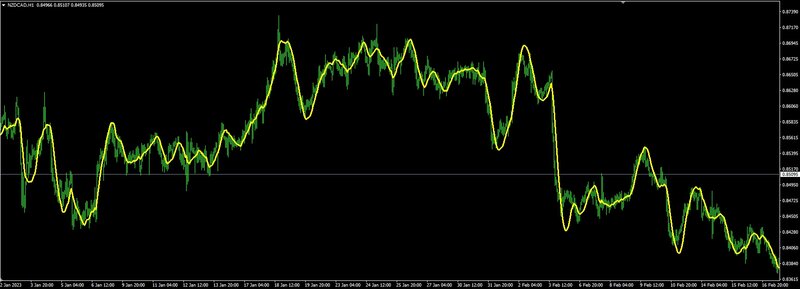
270SLSMA
Pretty neat zero lag moving average (Smoothed LSMA)
with default settings, it's pretty neat already :
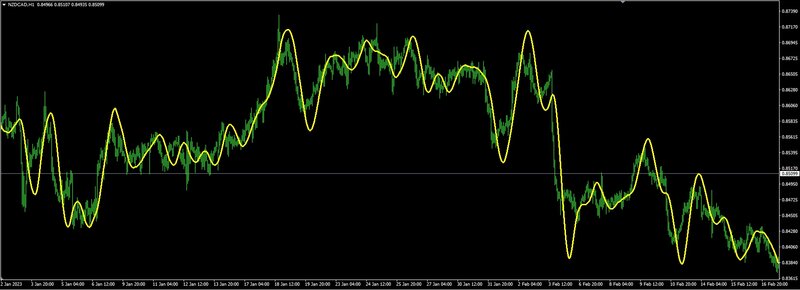
but set one period to "2" and have pretty cool results :
Pretty neat zero lag moving average (Smoothed LSMA)
with default settings, it's pretty neat already :
but set one period to "2" and have pretty cool results :
- These users thanked the author ionone for the post (total 2):
- Chickenspicy, andrei-1
Scalping the Century TimeFrame since 1999


