Do you mind telling us what this Zig Zag does, that other MTF Zig Zag versions can't? I'm away from the PC so can't actually look at it.
Re: Zig-Zag Indicators MT4
192Hi MrTools
Is it possible to please make this indi MTF - many thanks
Deane
Is it possible to please make this indi MTF - many thanks
Deane
Re: Zig-Zag Indicators MT4
193Hi
Does anyone have the Ctrader ZigZag indicator designed for MT4 perhaps?
Thanx in advance
Does anyone have the Ctrader ZigZag indicator designed for MT4 perhaps?
Thanx in advance
Re: Zig-Zag Indicators MT4
194Aroon ZigZag
Hello
Would it be possible to create a zigzag or arrows indicator from the aroon indicator?
Hello
Would it be possible to create a zigzag or arrows indicator from the aroon indicator?
Re: Zig-Zag Indicators MT4
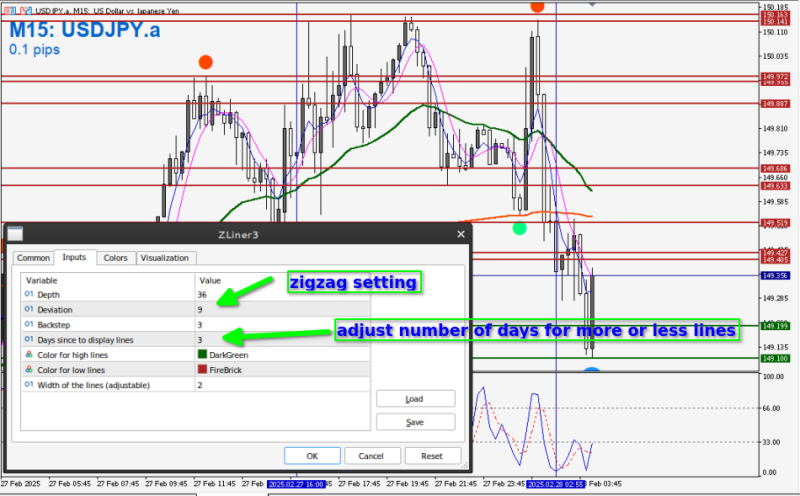
195The original code is not mine as you'll see in the Mql4 file, but what I did was add levels or horizontal lines where there were once arrows. And then mapped these to how many days back you want to start plotting the horizontal lines. What you get is a type of support resistance based on the zigzag. And also likely TP locations and where price might stop and reverse etc.
I really like using this indicator to help me see where price is moving to or moving from. It's not quite the usual SR lines which maybe 50 pips away from the actual price action. It's closer to where it's all happening.
Here's the idea... it makes them from the major zigzag levels only like this picture. The thought behind is zigzags offer a point of reference, where price did something, that is, moved in the opporsite direction. It's a point where something happened, decisions happened to make price change direction. So if these points are in a cluster, then that location is quite significant for price, representing lots of decisions in the past happened there.
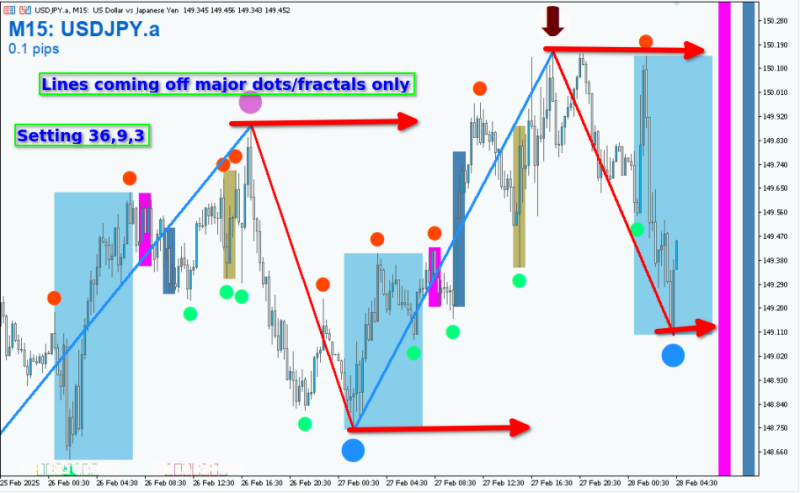
Looks like this and you can adjust the number of days back to keep the lines from crowding out the chart
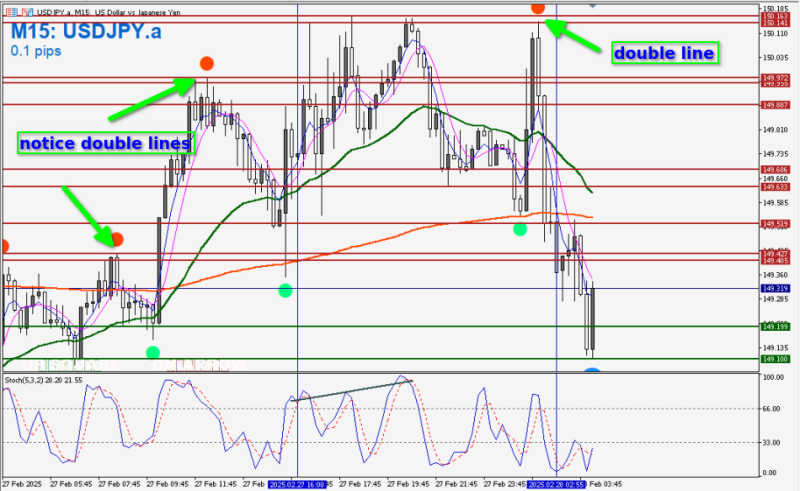
Notice how often the 'double line' areas are frequently visited by price.
 MT4 version:
Converted MT5 version
I really like using this indicator to help me see where price is moving to or moving from. It's not quite the usual SR lines which maybe 50 pips away from the actual price action. It's closer to where it's all happening.
Here's the idea... it makes them from the major zigzag levels only like this picture. The thought behind is zigzags offer a point of reference, where price did something, that is, moved in the opporsite direction. It's a point where something happened, decisions happened to make price change direction. So if these points are in a cluster, then that location is quite significant for price, representing lots of decisions in the past happened there.
Looks like this and you can adjust the number of days back to keep the lines from crowding out the chart
Notice how often the 'double line' areas are frequently visited by price.
Converted MT5 version
Re: Zig-Zag Indicators MT4
196mr.tools/exerts
any one has zigzag bars count numbers features in zigzag between point to point!
see sample
any one has zigzag bars count numbers features in zigzag between point to point!
see sample
"There is NO GOD higher than TRUTH" - Mahatma Gandhi
Re: Zig-Zag Indicators MT4
197Found these.sal wrote: Fri Jun 13, 2025 10:35 pm mr.tools/exerts
any one has zigzag bars count numbers features in zigzag between point to point!
see sample
Shalom Shalom! 
Re: Zig-Zag Indicators MT4
198i checked, this shows only pips values in version 1 and version 3 fib. levels
"There is NO GOD higher than TRUTH" - Mahatma Gandhi
Re: Zig-Zag Indicators MT4
199CORRECTsal wrote: Fri Jun 13, 2025 11:57 pm i checked, this shows only pips values in version 1 and version 3 fib. levels
Official Forex-station GIF animator at your service 
The best divergence indicator in the world.

The best divergence indicator in the world.
Re: Zig-Zag Indicators MT4
200On version 3 fib with fibs enabled used these settings to get what I think you are looking for.sal wrote: Fri Jun 13, 2025 11:57 pm i checked, this shows only pips values in version 1 and version 3 fib. levels
- Rating: 0.6%
Shalom Shalom!

