Yesterday Fibonacci Dashboard
(on/off button)
Please use this version which has better code and crashes less.
If the prices break out of yesterday's High, then they'll be in dark green color.
If the prices break out of yesterday's Low, then they'll be in maroon color.
Well, if they don’t break out, then it’s a consolidation day.
Re: Dashboard Type Indicators for MT4
543Market Display Monitor
Market Display Monitor is a Tool for observing Market Price movements.
Sometimes, Traders, whether they have already made a Transaction or Not, will briefly observe the Currency they're targeting to determine its Potential and Risk.
Some people simply need a Visual with Large text to see or Observe.
Remember, opening a Buy or Sell position isn't as Simple as relying on Bumbers and Colors.
Each Trading Strategy has No more than a 5% chance of Winning in the Market. Therefore, stick to One Trading Strategy with complete mastery.
Don't Mix and Match trading strategies.
Use Overbought / Oversold, so study everything related to Overbought.
NOTES in Check List :
- What is your trading strategy [Overbought / Oversold] ?
The appropriate grade is A, B.
The Logical reason is that the Price is already too High, making it safer with Less risk.
-- What is your trading strategy [Following the Trend Direction] ?
The appropriate grade is E, D.
The Logical reason is that the Price is Not yet too High, just Enough to make a Profit.
MEMO :
- All 'the Market Display Monitor' Indicators used in Percent (%) Calculated.
- Market Display Monitor based 'DAILY Time Frime'
-- Market Display Monitor Update Ke-2 based 'DAILY Time Frime'
--- Market Display Monitor Update Ke-3 can Choice DAILY / WEEKLY / MONTHLY ( Market) Time Frimes.
* Credits for Zorox as the Coder with his Strategy's.
- These users thanked the author Tsar for the post (total 10):
- Akela, BeatlemaniaSA, kvak, Narutopips, Cagliostro, thomdel, Jimmy, marant, ChuChu Rocket, Abdi
- Rating: 5.9%
Always looking the GREAT, never left GOOD Point...
Re: Dashboard Type Indicators for MT4
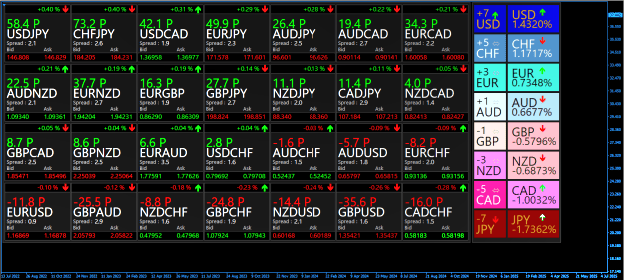
544ThanksTsar wrote: Tue Jan 20, 2026 11:41 pm Market Display Monitor
Market Display Monitor.png
Market Display Monitor is a Tool for observing Market Price movements.
Sometimes, Traders, whether they have already made a Transaction or Not, will briefly observe the Currency they're targeting to determine its Potential and Risk.
Some people simply need a Visual with Large text to see or Observe.
Remember, opening a Buy or Sell position isn't as Simple as relying on Bumbers and Colors.
Each Trading Strategy has No more than a 5% chance of Winning in the Market. Therefore, stick to One Trading Strategy with complete mastery.
Don't Mix and Match trading strategies.
Use Overbought / Oversold, so study everything related to Overbought.
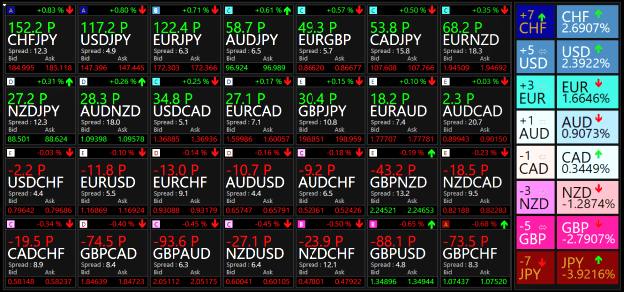
Market Display Monitor Update Ke-2.png
NOTES in Check List :
- What is your trading strategy [Overbought / Oversold] ?
The appropriate grade is A, B.
The Logical reason is that the Price is already too High, making it safer with Less risk.
-- What is your trading strategy [Following the Trend Direction] ?
The appropriate grade is E, D.
The Logical reason is that the Price is Not yet too High, just Enough to make a Profit.
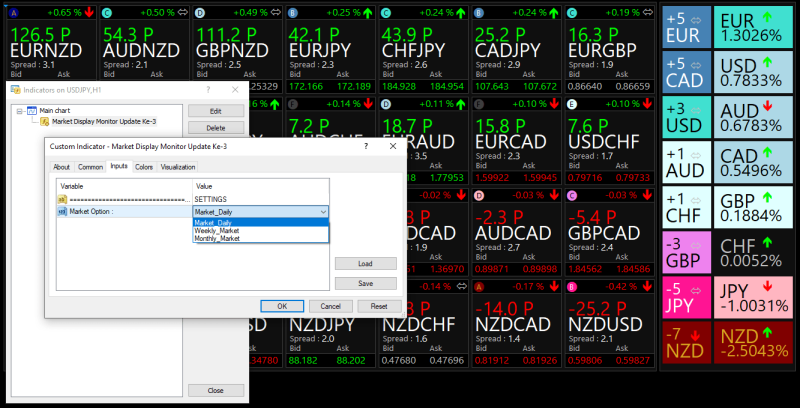
Market Display Monitor Update Ke-3.png
MEMO :
- All 'the Market Display Monitor' Indicators used in Percent (%) Calculated.
- Market Display Monitor based 'DAILY Time Frime'
-- Market Display Monitor Update Ke-2 based 'DAILY Time Frime'
--- Market Display Monitor Update Ke-3 can Choice DAILY / WEEKLY / MONTHLY ( Market) Time Frimes.
* Credits for Zorox as the Coder with his Strategy's.
A man's Past is his Pride, But my Pride is Shaping the Future.
 Re: Dashboard Type Indicators for MT4
545
Tsar posting fire lately. This is one of the nicest market display tools for MT4 and surprisingly fast

- These users thanked the author ChuChu Rocket for the post:
- Tsar
- Rating: 0.6%
Re: Dashboard Type Indicators for MT4
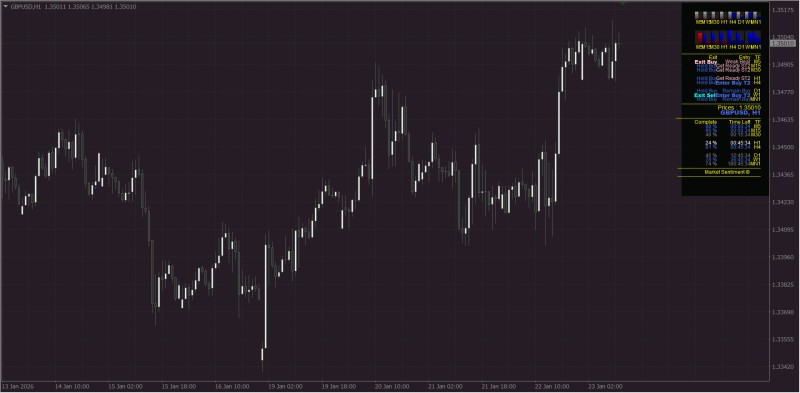
546Market Sentiment ©
Market sentiment, also known as Investor attention, is the General prevailing attitude of investors as to anticipated price development in the Market.
This attitude is the accumulation of a variety of Fundamental and Technical factors, including Price history, economic reports, seasonal factors, and national and World events.
If Investors expect Upward price movement in the Stock Market, the sentiment is said to be Bullish. On the contrary, if the Market sentiment is Bearish, most investors expect Downward price movement. Market participants who maintain a Static sentiment, regardless of Market conditions, are described as permabulls and permabears respectively.
Market sentiment is usually considered as a Contrarian indicator: what most people expect is a Good thing to bet against.
Market sentiment is used because it is believed to be a Good predictor of Market moves, especially when it is more Extreme.
Market sentiment is monitored with a variety of technical and statistical methods such as the number of advancing versus declining stocks and new highs versus new lows comparisons. A large share of the overall movement of an individual stock has been attributed to market sentiment.
- Rating: 0.6%
Always looking the GREAT, never left GOOD Point...
