Ehlers Indicators for TradeStation
Links: |TradeStation|NinjaTrader|MT4|MT5|Python|
Re: Ehlers Indicators for TradeStation
2JOHN EHLERS
 John Ehlers is a highly respected figure in the world of technical analysis, particularly known for his innovative application of digital signal processing (DSP) concepts to financial time series data, which is heavily used in Forex trading.
His work focuses on treating price data like a signal and using filters, transforms, and cycles theory to isolate true market movement from noise. He is often credited with popularizing the idea that cycles and spectral analysis are critical to understanding and predicting price action.
 Key Contributions and Concepts
Ehlers's work is based on several advanced mathematical techniques, most notably:
1. Digital Signal Processing (DSP) and Filtering
Ehlers views the market as a noisy signal that needs to be "filtered" to reveal underlying trends and cycles.
Perhaps his most famous contribution is the Fisher Transform. This mathematical technique converts the price data (which is generally assumed to have a non-normal distribution) into a distribution that is approximately Gaussian (normally distributed).
Ehlers used MESA to identify and measure dominant market cycles.
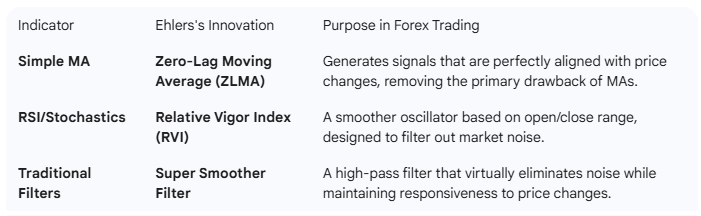
Many of the indicators Ehlers has published are modifications of traditional tools, but with the lag drastically reduced or eliminated, making them ideal for the fast-paced Forex market:
 Notable Publications
Ehlers has authored several foundational books that explain how to apply these DSP methods using standard trading platforms (MQL4/MQL5, EasyLanguage, etc.): Ehlers's Relevance to Forex Trading
The techniques pioneered by John Ehlers are particularly relevant in Forex because:
His work focuses on treating price data like a signal and using filters, transforms, and cycles theory to isolate true market movement from noise. He is often credited with popularizing the idea that cycles and spectral analysis are critical to understanding and predicting price action.
 Key Contributions and Concepts
Ehlers's work is based on several advanced mathematical techniques, most notably:
1. Digital Signal Processing (DSP) and Filtering
Ehlers views the market as a noisy signal that needs to be "filtered" to reveal underlying trends and cycles.
- Lag Reduction: Traditional moving averages (MAs) suffer from significant lag, causing late entry and exit signals. Ehlers developed filters that minimize this lag.
- Decycler and Roofing Filter: He created unique filters designed to remove long-term cycles (Decycler) or to isolate specific high-frequency cycles (Roofing Filter), allowing traders to see the price action between specific frequency bands.
Perhaps his most famous contribution is the Fisher Transform. This mathematical technique converts the price data (which is generally assumed to have a non-normal distribution) into a distribution that is approximately Gaussian (normally distributed).
- How it Works: By normalizing the price data, Ehlers claimed he could reliably identify price extremes and turning points. The resulting indicator oscillates between upper and lower extremes, making trend changes very clear.
Ehlers used MESA to identify and measure dominant market cycles.
- Cycle Identification: MESA is a technique for estimating the power spectral density of a signal. In trading, this means it can pinpoint the most powerful and regular price cycle currently influencing the market (e.g., a 20-bar cycle, a 40-bar cycle, etc.).
- Adaptive Indicators: Once the dominant cycle is known, Ehlers suggested creating "adaptive" indicators, such as adaptive moving averages, whose lookback period automatically adjusts to match the dominant cycle length. This makes the indicator highly responsive to current market conditions.
Many of the indicators Ehlers has published are modifications of traditional tools, but with the lag drastically reduced or eliminated, making them ideal for the fast-paced Forex market:
 Notable Publications
Ehlers has authored several foundational books that explain how to apply these DSP methods using standard trading platforms (MQL4/MQL5, EasyLanguage, etc.):
- Cybernetic Analysis for Stocks and Futures (2004)
- MESA and Trading Market Cycles (2008)
- Cycle Analytics for Traders (2013)
- Predictive Models for Trading Systems (2017)
 Ehlers's Relevance to Forex Trading
The techniques pioneered by John Ehlers are particularly relevant in Forex because:
- Fast Execution: Forex pairs often require very fast entry and exit to capture small moves. Ehlers's focus on lag elimination provides a competitive edge over standard lagging indicators.
- Noise Reduction: Forex markets are frequently characterized by high levels of short-term noise and choppiness. His use of Digital Filters helps traders see the underlying trend through the volatility.
- Cycle Dominance: Currency pairs are often influenced by predictable economic and calendar cycles (e.g., London open, New York close). MESA provides a mathematical basis for exploiting these periodic patterns.
- Rating: 0.6%
Re: Ehlers Indicators for TradeStation
3The Reversion Index
Links: |TradingView|TradeStation|NinjaTrader|MT4|MT5|Python|

TradeStation: January 2026
In John Ehlers’ article in this issue, “The Reversion Index,” he presents an indicator that produces timely buy and sell signals for mean-reversion strategies by summing bar-to-bar price changes and normalizing them by their absolute values. He explains that the summation should cover about half of the dominant cycle in the data, and that peaks and valleys are identified by the crossings of two SuperSmoother filters with different lengths. The reversion index is a normalized sum of price differences that oscillates between -1 and +1.
EasyLanguage code for the reversion index is shown here. A sample chart of the reversion index is shown in the picture below.
------------------------------------------------------------------------------------------------
DOWNLOAD:
ReversionIndex.pdf
Links: |TradingView|TradeStation|NinjaTrader|MT4|MT5|Python|
TradeStation: January 2026
In John Ehlers’ article in this issue, “The Reversion Index,” he presents an indicator that produces timely buy and sell signals for mean-reversion strategies by summing bar-to-bar price changes and normalizing them by their absolute values. He explains that the summation should cover about half of the dominant cycle in the data, and that peaks and valleys are identified by the crossings of two SuperSmoother filters with different lengths. The reversion index is a normalized sum of price differences that oscillates between -1 and +1.
EasyLanguage code for the reversion index is shown here. A sample chart of the reversion index is shown in the picture below.
Code: Select all
{
	TASC JAN 2026
	Reversion Index
	(C) 2005 John F. Ehlers
}

inputs:
	Length( 20 );

variables:
	DeltaSum( 0 ),
	AbsDeltaSum( 0 ),
	Count( 0 ),
	Ratio( 0 ),
	Smooth( 0 ),
	Trigger( 0 );

DeltaSum = 0;
AbsDeltaSum = 0;

for Count = 0 to Length - 1
begin
	DeltaSum = DeltaSum + Close[Count] - Close[Count + 1];
	AbsDeltaSum = AbsDeltaSum + AbsValue( Close[Count]
	 - Close[Count + 1] );
end;

if AbsDeltaSum <> 0 then
	Ratio = DeltaSum / AbsDeltaSum;

Smooth = $SuperSmoother( Ratio, 8 );
Trigger = $SuperSmoother( Ratio, 4 );

Plot1( Smooth, "Smooth" );
Plot2( 0, "Zero" );
Plot3( Trigger, "Triger" );

Function: $SuperSmoother

{
	SuperSmoother Function
 	(C) 2025 John F. Ehlers
}

inputs:
	Price(numericseries),
	Period(numericsimple);

variables:
	a1( 0 ),
	b1( 0 ),
	c1( 0 ),
	c2( 0 ),
	c3( 0 );

a1 = ExpValue(-1.414 * 3.14159 / Period);
b1 = 2 * a1 * Cosine(1.414 * 180 / Period);
c2 = b1;
c3 = -a1 * a1;
c1 = 1 - c2 - c3;

if CurrentBar >= 4 then
	$SuperSmoother = c1*(Price + Price[1]) / 2
	 + c2 * $SuperSmoother[1] + c3 * $SuperSmoother[2];
if CurrentBar < 4 then
	$SuperSmoother = Price;
DOWNLOAD:
ReversionIndex.pdf
- Rating: 0.6%
Re: Ehlers Indicators for TradeStation
4PMA: projected moving average
Links: |TradingView|TradeStation|NinjaTrader|MT4|MT5|Python|
TradeStation: March 2025
In “Removing Moving Average Lag” in this issue, John Ehlers introduces a projected moving average (PMA) designed to remove the lag inherent in moving averages. He does this by adding the slope times half the length of the average to the average itself. A function labeled $PMA is provided for the calculations. A sample chart displaying the PMA, the PMA slope, and its prediction, as discussed in Ehlers’ article.
Code: Select all
Function: $PMA
{
	TASC MAR 2025
	Projected Moving Average ($PMA) Function
	(C) 2024 John F. Ehlers
}

inputs:
	Price( numericseries ),
	Length( numericsimple ),
	PMA( numericref ),
	Slope( numericref ),
	SMA( numericref );

variables:
	Count( 0 ),
	Sx( 0 ),
	Sy( 0 ),
	Sxx( 0 ),
	Syy( 0 ),
	Sxy( 0 );

Sx = 0;
Sy = 0;
Sxx = 0;
Syy = 0;
Sxy = 0;

for Count = 1 to Length
begin
	Sx = Sx + Count;
	Sy = Sy + Price[Count - 1];
	Sxx = Sxx + Count * Count;
	Syy = Syy + Price[Count - 1] * Price[Count - 1];
	Sxy = Sxy + count*Price[Count - 1];
end;

Slope = -(Length * Sxy - Sx * Sy) / (Length * Sxx - Sx * Sx);
SMA = Sy / Length;
PMA = SMA + Slope * Length / 2;

//Function Return Value
$PMA = 1;


Indicator: Projected Moving Average (PMA)
{
	TASC MAR 2025
	Projected Moving Average (PMA)
	(C) 2024 John F. Ehlers
}

inputs:
	Length( 20 );

variables:
	ReturnValue( 0 ),
	PMA( 0 ),
	Slope( 0 ),
	SMA( 0 ),
	Predict( 0 );

ReturnValue = $PMA(Close, Length, PMA, Slope, SMA);
Predict = PMA + .5 * (Slope - Slope[2])*Length;

Plot1( PMA, "PMA" );
Plot2( Predict, "Predict" );
//Plot3( SMA, "SMA" )


Indicator: PMA Slope and Prediction
{
	TASC MAR 2025
	PMA Slope and Its Prediction
	(C) 2024 John F. Ehlers
}

inputs:
	Length( 20 );

variables:
	ReturnValue( 0 ),
	PMA( 0 ),
	Slope( 0 ),
	SMA( 0 ),
	Predict( 0 );

ReturnValue = $PMA(Close, Length, PMA, Slope, SMA);
Predict = 1.5 * Slope - .5 * Slope[4];

Plot1( Slope, "Slope" );
Plot2( 0, "Zero Line" );
Plot3( Predict, "Predict" );
- Rating: 0.6%
Re: Ehlers Indicators for TradeStation
5The Continuation Index
Links: |TradingView|TradeStation|NinjaTrader|MT4|MT5|Python|
TradeStation: September 2025
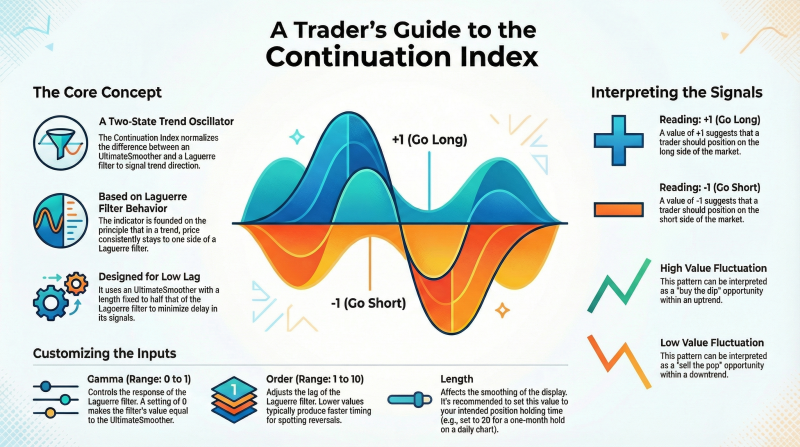
In “The Continuation Index” in this issue,
John Ehlers presents an indicator named the continuation index,
designed to signal both the early onset and
potential exhaustion of a trend.
The indicator is based on the Laguerre filter and reduces computational lag using the UltimateSmoother filter.
 -----------------------------------------------------------------------------------------------------
DOWNLOAD:
The Continuation Index.pdf
Links: |TradingView|TradeStation|NinjaTrader|MT4|MT5|Python|
TradeStation: September 2025
In “The Continuation Index” in this issue,
John Ehlers presents an indicator named the continuation index,
designed to signal both the early onset and
potential exhaustion of a trend.
The indicator is based on the Laguerre filter and reduces computational lag using the UltimateSmoother filter.
Code: Select all
{
 	TASC SEPTEMBER 2025
	Continuation Index
	(C) 2025 John F. Ehlers
}
inputs:
	Gama( .8 ),
	Order( 8 ),
	Length( 40 );

variables:
	US( 0 ),
	LG( 0 ),
	Ref( 0 ),
	Variance( 0 ),
	CI( 0 );

//Ultimate Smoother
US = $UltimateSmoother(Close, Length / 2);
//Laguerre Filter
LG = $Laguerre(Close, Gama, Order, Length);
//Average the filter difference
Variance = Average(AbsValue(US - LG), Length);
//Double the normalized variance
if Variance <> 0 then
	Ref = 2*(US - LG) / Variance;
//Compress using an Inverse Fisher Transform
CI = ( ExpValue(2 * Ref) - 1) / (ExpValue(2 * Ref) + 1);

plot1( CI );
Plot2( 0 );

Function: $Laguerre
{
 Laguerre Filter Function
 (C) 2005-2022 John F. Ehlers

 Usage: $Laguerre(Price, gama, Order, Length);
 ` gama must be less than 1 and equal to or greater
 than zero order must be an integer, 10 or less
}
inputs:
	Price( numericseries ),
	Gama( numericsimple ),
	Order( numericsimple ),
	Length( numericsimple );

variables:
	Count( 0 ),
	FIR( 0 );

arrays:
	LG[10, 2]( 0 );

//load the current values of the arrays to be the values
// one bar ago
for count = 1 to order
begin
	LG[count, 2] = LG[count, 1];
end;

//compute the Laguerre components for the current bar
for count = 2 to order
begin
	LG[count, 1] = -gama*LG[count - 1, 2] + LG[count - 1, 2]
	 + gama*LG[count, 2];
End;

LG[1, 1] = $UltimateSmoother(Price, Length);
//sum the Laguerre components
FIR = 0;
for count = 1 to order
begin
	FIR = FIR + LG[count, 1];
end;

$Laguerre = FIR / order;

Function: $SuperSmoother
{
	UltimateSmoother Function
	(C) 2004-2025 John F. Ehlers
}

inputs:
	Price( numericseries ),
	Period( numericsimple );

variables:
	a1( 0 ),
	b1( 0 ),
	c1( 0 ),
	c2( 0 ),
	c3( 0 ),
	US( 0 );

a1 = ExpValue(-1.414*3.14159 / Period);
b1 = 2 * a1 * Cosine(1.414*180 / Period);
c2 = b1;
c3 = -a1 * a1;
c1 = (1 + c2 - c3) / 4;

if CurrentBar >= 4 then
 US = (1 - c1)*Price + (2 * c1 - c2) * Price[1]
 - (c1 + c3) * Price[2] + c2*US[1] + c3 * US[2];

if CurrentBar < 4 then
	US = Price;

$UltimateSmoother = US;
DOWNLOAD:
The Continuation Index.pdf
- Rating: 1.2%
Re: Ehlers Indicators for TradeStation
6One Euro filter
Links: |TradingView|TradeStation|NinjaTrader|MT4|MT5|Python|
Tradestation: December 2025
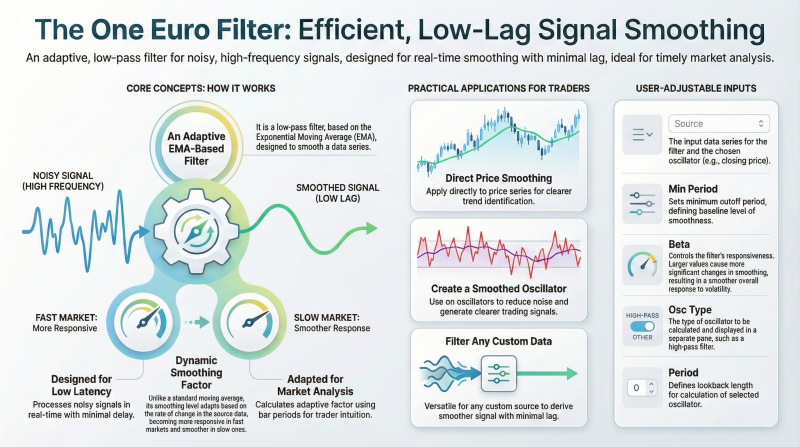
In “The One Euro Filter” in this issue, John Ehlers presents the one euro filter indicator, originally developed by Georges Casiez, Nicolas Roussel, and Daniel Vogel. Unlike a conventional exponential moving average (EMA) that relies on a fixed smoothing constant, this indicator dynamically adjusts its coefficient in response to the rate of change in the input signal.
Links: |TradingView|TradeStation|NinjaTrader|MT4|MT5|Python|
Tradestation: December 2025
In “The One Euro Filter” in this issue, John Ehlers presents the one euro filter indicator, originally developed by Georges Casiez, Nicolas Roussel, and Daniel Vogel. Unlike a conventional exponential moving average (EMA) that relies on a fixed smoothing constant, this indicator dynamically adjusts its coefficient in response to the rate of change in the input signal.
Code: Select all
{
	TASC DEC 2025
	One Euro Filter Indicator
	From "1€ Filter: A Simple Speed-Based Low-Pass Filter
	For Noisy Input In Interactive Systems" (CHI 2012)
	By Georges Casiez, Nicolas Roussel, and Daniel Vogel
	(C) 2025 John F. Ehlers
}

inputs:
	PeriodMin( 10 ), // Minimum cutoff frequency
	BetaVal( 0.2 ); // Responsiveness factor

variables:
	Price( 0 ),
	PeriodDX( 10 ),
	AlphaDX( 0 ),
	SmoothedDX( 0 ),
	Cutoff( 0 ),
	Alpha3( 0 ),
	Smoothed( 0 );

Price = Close;
AlphaDX = 2 * 3.14159 / (4 * 3.14159 + PeriodDX);

// Initialize
if CurrentBar = 1 then
begin
	SmoothedDX = 0;
	Smoothed = Price;
end;

// EMA the Delta Price
SmoothedDX = AlphaDX * (Price - Price[1]) + (1 -
 AlphaDX) * SmoothedDX[1];
// Adjust cutoff period based on fraction of the rate of
// change
Cutoff = PeriodMin + BetaVal * AbsValue(SmoothedDX);
// Compute adaptive alpha
Alpha3 = 2*3.14159 / (4 * 3.14159 + Cutoff);
//Adaptive smoothing
Smoothed = Alpha3 * Price + (1 - Alpha3) * Smoothed[1];
//Plot
Plot1( Smoothed );
- Rating: 1.2%
Re: Ehlers Indicators for TradeStation
7Cybernetic Oscillator
Links: |TradingView|TradeStation|NinjaTrader|MT4|MT5|Python|Excel|
TradeStation: June 2025
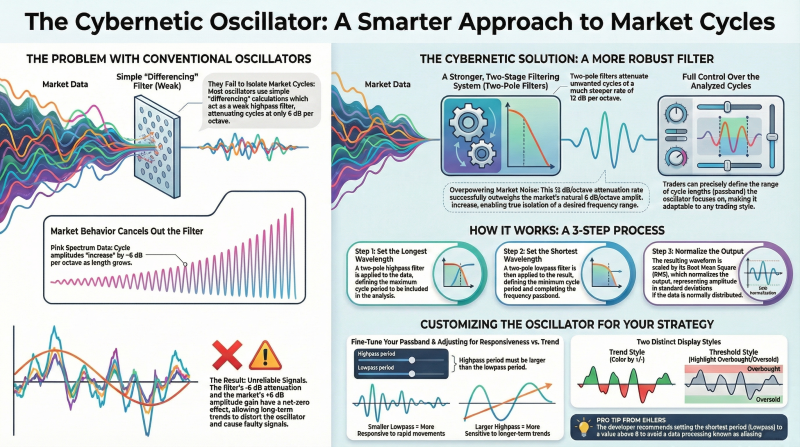
In the article “Making A Better Oscillator” in this issue, John Ehlers introduces a new indicator he calls the cybernetic oscillator. This indicator applies a multistep filter. The data is smoothed using a highpass filter ($HighPass function), which is then smoothed using the lowpass filter ($SuperSmoother function). The result is then scaled to its RMS (root mean squared).
Links: |TradingView|TradeStation|NinjaTrader|MT4|MT5|Python|Excel|
TradeStation: June 2025
In the article “Making A Better Oscillator” in this issue, John Ehlers introduces a new indicator he calls the cybernetic oscillator. This indicator applies a multistep filter. The data is smoothed using a highpass filter ($HighPass function), which is then smoothed using the lowpass filter ($SuperSmoother function). The result is then scaled to its RMS (root mean squared).
Code: Select all
{
	TASC JUN 2025
	Cybernetic Oscillator
	(C) 2025 John F. Ehlers
}

inputs:
	HPLength( 30 ),
	LPLength( 20 );

variables:
	HP( 0 ),
	LP( 0 ),
	RMS( 0 ),
	CyberneticOsc( 0 );

HP = $HighPass(Close, HPLength);
LP = $SuperSmoother(HP, LPLength);
RMS = $RMS(LP, 100);

if RMS <> 0 then
	CyberneticOsc = LP / RMS;

Plot1( CyberneticOsc, "Cybernetic Osc" );
Plot2( 0, "Zero Line" );

Function: $HighPass
{
	$HighPass Function
 	(C) 2004-2025 John F. Ehlers
}

inputs:
	Price(numericseries),
	Period(numericsimple);

variables:
	a1( 0 ),
	b1( 0 ),
	c1( 0 ),
	c2( 0 ),
	c3( 0 );

a1 = ExpValue(-1.414 * 3.14159 / Period);
b1 = 2 * a1 * Cosine(1.414 * 180 / Period);
c2 = b1;
c3 = -a1 * a1;
c1 = (1 + c2 - c3) / 4;

if CurrentBar >= 4 then
 	$HighPass = c1*(Price - 2 * Price[1] + Price[2]) +
	 c2 * $HighPass[1] + c3 * $HighPass[2];
if Currentbar < 4 then
	$HighPass = 0;

Function: $SuperSmoother
{
	$SuperSmoother Function
 	(C) 2004-2025 John F. Ehlers
}

inputs:
	Price(numericseries),
	Period(numericsimple);

variables:
	a1( 0 ),
	b1( 0 ),
	c1( 0 ),
	c2( 0 ),
	c3( 0 );

a1 = ExpValue(-1.414 * 3.14159 / Period);
b1 = 2 * a1 * Cosine(1.414 * 180 / Period);
c2 = b1;
c3 = -a1 * a1;
c1 = 1 - c2 - c3;

if CurrentBar >= 4 then
	$SuperSmoother = c1*(Price + Price[1]) / 2
	 + c2 * $SuperSmoother[1] + c3 * $SuperSmoother[2];
if CurrentBar < 4 then
	$SuperSmoother = Price;

Indicator: $RMS
{
	RMS Function
	(C) 2015-2025 John F. Ehlers
}

inputs:
	Price( numericseries ),
	Length( numericsimple );

variables:
	SumSq( 0 ),
	count( 0 );

SumSq = 0;

for count = 0 to Length - 1
begin
	SumSq = SumSq + Price[count] * Price[count];
end;

If SumSq <> 0 then
	$RMS = SquareRoot(SumSq / Length);
- Rating: 1.8%
Re: Ehlers Indicators for TradeStation
9John Ehlers is like an electronic professor, and we’re attending his college classes.Abdi wrote: Fri Dec 26, 2025 10:01 pm This infographics you are providing with your indicators are awesome. The information and the visuals. Thanks for sharing.
- Rating: 1.2%
Re: Ehlers Indicators for TradeStation
10And you are making it perfectly digestable for us slow leanersBanzai wrote: Sat Dec 27, 2025 2:28 am John Ehlers is like an electronic professor, and we’re attending his college classes.
Awesome.
- Rating: 0.6%


