Re: Banzai's Trading System
83DONCHIAN CHANNEL 3-CANDLE BREAKOUT
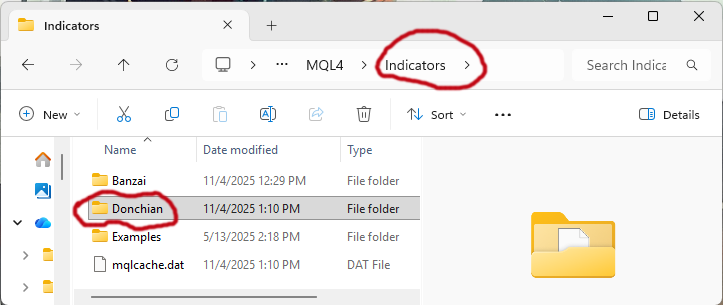 Copy the whole Donchian folder to the Indicators folder.
And put the template in the template folder.
Step 1: Check the Daily Woodie Pivot (DailyWoodiePivot BT.mq4)
Step 2: Check the 5-Weekly High Low (5WeekHL BT.mq4). It's the High and the Low of each week.
Step 3: Check the Currency Strength (Currency_Strength BT.mq4). If USD is strong, then GOLD is going downhill.
Step 4: Check the divergences on the ZeroLag MACD (4,10,5). (ZeroLag MACD 1.02 (MTF) FAST BT.mq4)
Step 5: Now check the Donchian Channel. If you see a green arrow, go LONG.
It's alternating. 1 green box. Then 1 red box. 1 green box. 1 red box, etc...
This indicator checks a group of 3 candlesticks and determines a breakout is to the upside or downside.
Step 6: Confirm with the ikokunomatome indicator. (ikokunomatome ahtf.mq4) If 5 out of 6 are green, go LONG.
MACD (4,10,5) is always lagging behind 1 candlestick. (Not the ZeroLag MACD).
Step 7: Meanwhile, check the Fibonacci Lines of yesterday's High and Low.
Step 8: Use M15 charts or higher timeframes.
- These users thanked the author Banzai for the post (total 4):
- Cagliostro, Jimmy, Lucas, Tsar
- Rating: 2.4%
Re: Banzai's Trading System
84For Gold on Tuesday, November 4, 2025,
we forgot to draw a trend line.
It's multitasking and there's so many things to watch.
we forgot to draw a trend line.
It's multitasking and there's so many things to watch.
- Rating: 0.6%
Re: Banzai's Trading System
85PULLBACK
So what exactly is a pullback in Forex?
A pullback is where the traders retreat.
Get some more soldiers to storm the castle gate.
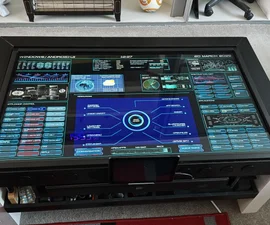 Best way to explain is to place the computer monitor on the coffee table.
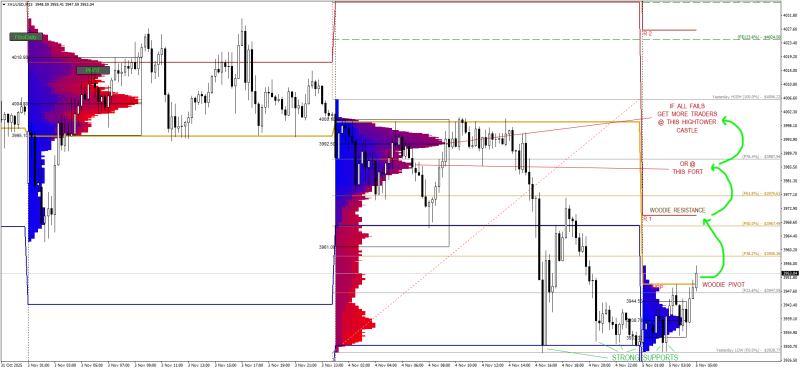 On Wednesday, November 5, 2025, in the Asian session.
Gold has a strong support at the bottom around $3928.
Traders failed to break the support wall/fence.
So traders pullback to the Woodie Pivot indicator to get some more soldiers.
Gold traders tried again to break the firewall at the bottom but can't.
Traders now have to pullback to Woodie Resistance (1) indicator to get some more strong soldiers.
Woodie Resistance (1) is around Fibonacci 50% of the previous day.
So it's a good price to pullback.
If that fails, then traders have to pullback to the high-tower castle
of the Market Profile indicator to get some more supermen.
In the endgame, traders will try to break the bottom firewall around $3928 again.
 But why should traders go downhill?
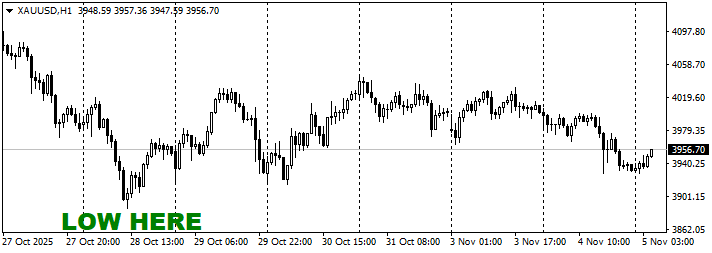
Because we already have a low on October 28, 2025, at around $3886.64.
Traders will try to break that low @ $3886.64.
So what exactly is a pullback in Forex?
A pullback is where the traders retreat.
Get some more soldiers to storm the castle gate.
Gold has a strong support at the bottom around $3928.
Traders failed to break the support wall/fence.
So traders pullback to the Woodie Pivot indicator to get some more soldiers.
Gold traders tried again to break the firewall at the bottom but can't.
Traders now have to pullback to Woodie Resistance (1) indicator to get some more strong soldiers.
Woodie Resistance (1) is around Fibonacci 50% of the previous day.
So it's a good price to pullback.
If that fails, then traders have to pullback to the high-tower castle
of the Market Profile indicator to get some more supermen.
In the endgame, traders will try to break the bottom firewall around $3928 again.
Because we already have a low on October 28, 2025, at around $3886.64.
Traders will try to break that low @ $3886.64.
- These users thanked the author Banzai for the post (total 4):
- ashdays, RodrigoRT7, mazibee, JCCTREND
- Rating: 2.4%
Re: Banzai's Trading System
86Since October 22, 2025,
Gold didn't break out to the upside.
Hmm.
We have all the tools on MT4.
Gold didn't break out to the upside.
Hmm.
We have all the tools on MT4.
- These users thanked the author Banzai for the post:
- forexjoe85
- Rating: 0.6%
Re: Banzai's Trading System
87SUPPORT & RESISTANCE
1) When you see a support became a resistance,
draw a thick line.
2) When you see a resistance became a support,
draw a thick line.
Just look to the left.
1) When you see a support became a resistance,
draw a thick line.
2) When you see a resistance became a support,
draw a thick line.
Just look to the left.
- Rating: 0.6%
Re: Banzai's Trading System
88GOLD, Thursday 11/6/2025
Volume/Market Profile indicator
For MT4, please go here and choose a cool Volume/Market Profile indicator:
market-and-volume-profile-indicators-fo ... 15-80.html
For MT5, please go here:
market-profile-indicators-for-mt5-t8475784.html
I can't upload today. Forum is down. Please come back.
- These users thanked the author Banzai for the post (total 2):
- DmitrySCLP, Tsar
- Rating: 1.2%
Re: Banzai's Trading System
89VOLUME PROFILE
Here's the MT4 Volume Profile indicator.
I couldn't upload it yesterday. HTTP error.
I can't find a good MT5 indicator.
But you can try other MT5 indicator over here:
market-profile-indicators-for-mt5-t8475784.html
So you trade 1 level at a time.
Here's the MT4 Volume Profile indicator.
I couldn't upload it yesterday. HTTP error.
I can't find a good MT5 indicator.
But you can try other MT5 indicator over here:
market-profile-indicators-for-mt5-t8475784.html
So you trade 1 level at a time.
- Rating: 0.6%
Re: Banzai's Trading System
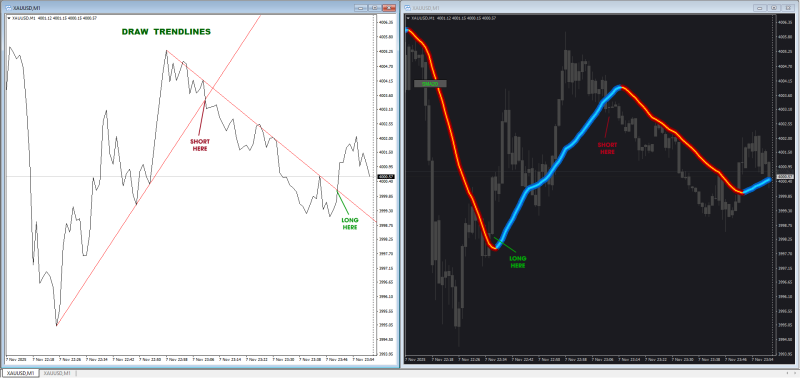
90TREND LINES
In day trading, some traders draw a trend line.
If the prices cross over the line, then they go LONG/BUY.
If the prices cross under the line, they go SHORT/SELL.
Now we can apply the same technique to a MOVING AVERAGE.
My pick is SMA(20).
SMA(20) is the default middle line of a Bollinger Band.
If a full candle is above the SMA(20), then go LONG/BUY.
Vice versa for short.
If a full candle is below the SMA(20), then go SHORT/SELL.
The neon colors are courtesy of our webmaster, Jimmy.
post1295548443.html#p1295548443
As you can see in the picture, SMA(20) is a powerful indicator.
- Rating: 10.1%


