My email: marcelouff@gmail.com
 Re: TREND FOLOWING
12
PROFITT3 ASSISTANT
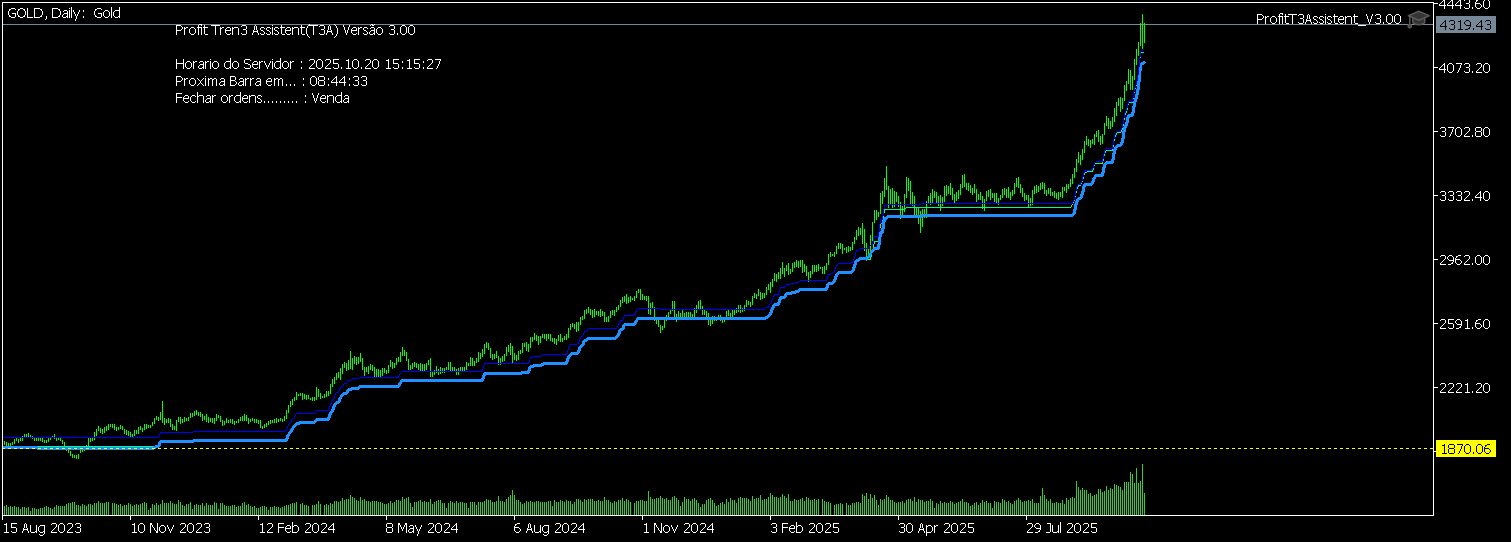
Attached is the file of the trading tool I use, it is a Trading Assistant, I choose the size of the order and it controls, makes partial exits, and stops when the color of the line changes. Very simple and powerful, the logic is quite simple. Let the profits run and cut the losses. I will leave the system file here in the post. Valid until 11/01/2025, for testing. Just save it in the expert folder, configure the trend and the timeframe, and surf the trends.
I'M LEAVING MY EMAIL FOR QUESTIONS.
marcelouff@gmail.com
USDJPY 5M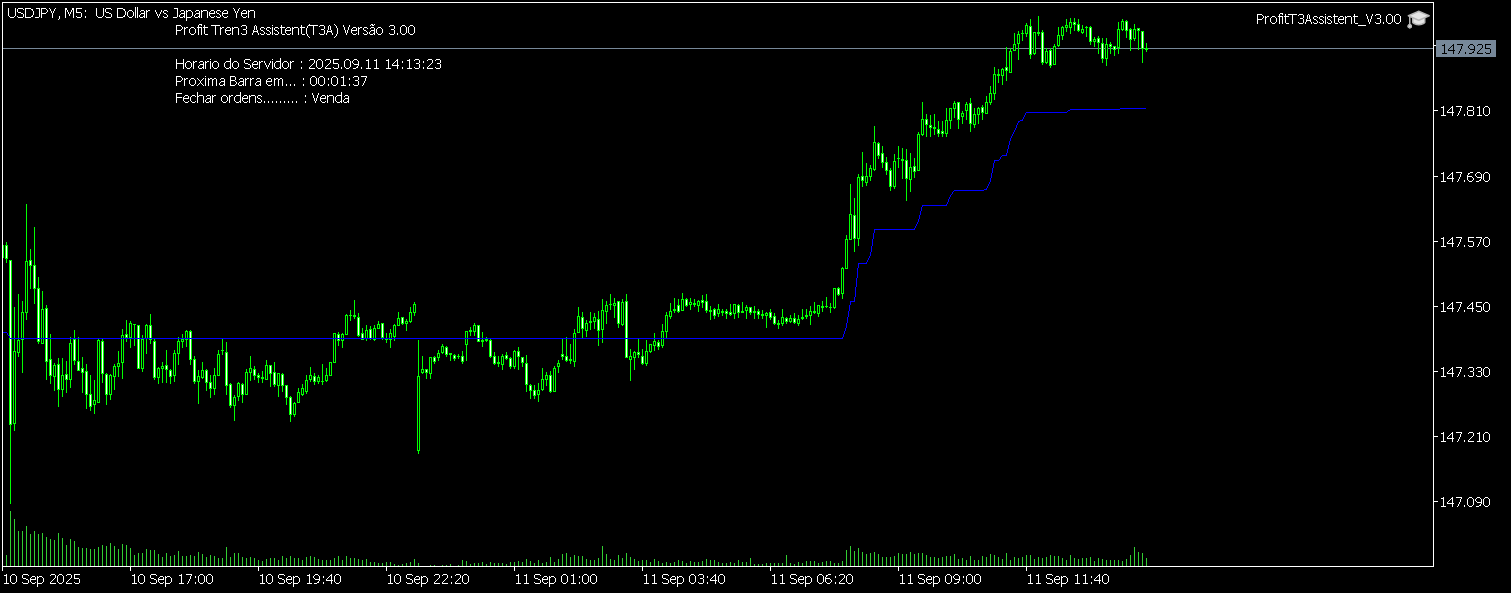 SP500 3M
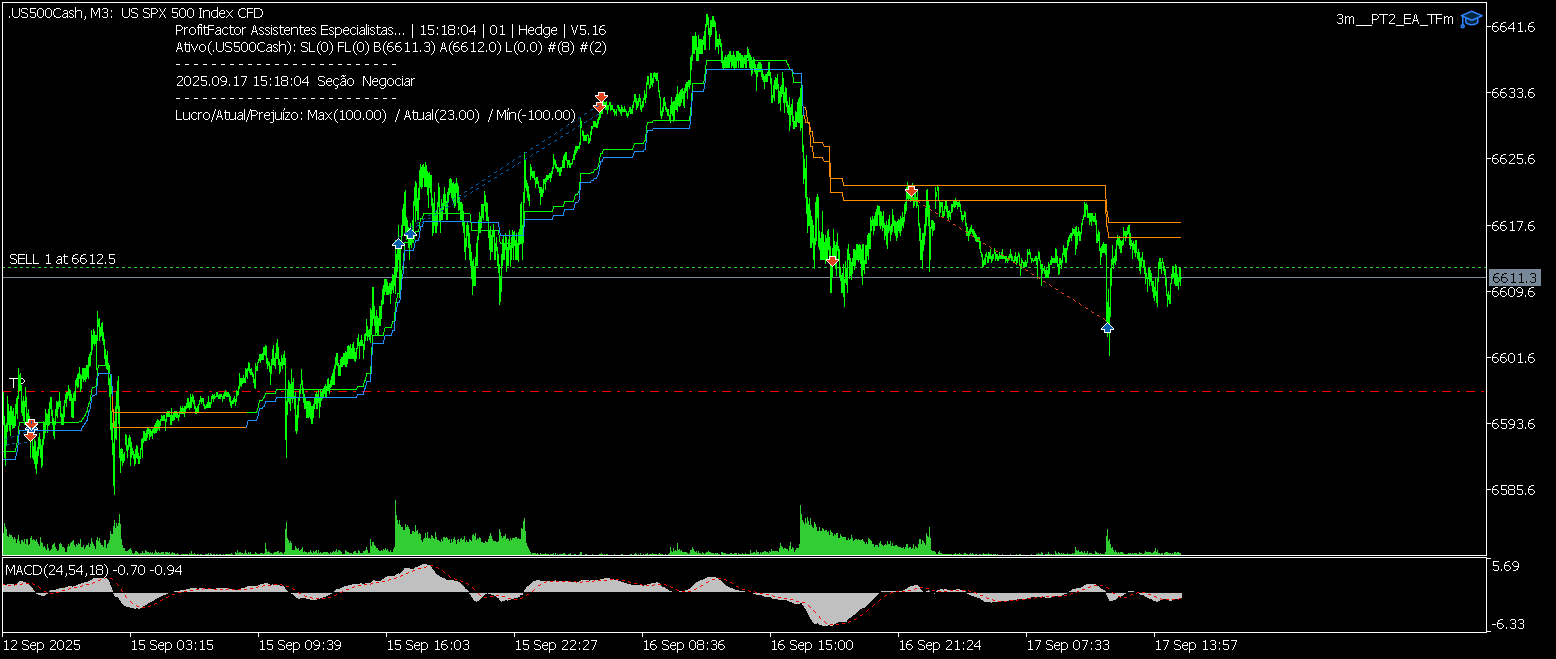
Attached is the file of the trading tool I use, it is a Trading Assistant, I choose the size of the order and it controls, makes partial exits, and stops when the color of the line changes. Very simple and powerful, the logic is quite simple. Let the profits run and cut the losses. I will leave the system file here in the post. Valid until 11/01/2025, for testing. Just save it in the expert folder, configure the trend and the timeframe, and surf the trends.
I'M LEAVING MY EMAIL FOR QUESTIONS.
marcelouff@gmail.com
USDJPY 5M
Re: TREND FOLOWING
13RANGE BARS
Range bars are a type of market chart that ignores time and focuses solely on price movement. Each bar has the same height, set by the trader, and is only created when the price moves by a specific amount (the "range"). This makes them less cluttered and easier to identify trends than time-based charts
How they work
Price-based, not time-based: Unlike candlestick or line charts, which are influenced by time, range bars don't care how long an asset takes to move.
Fixed-size bar: A trader sets a specific size for the bar (e.g., 10 ticks or points).
New bar creation: A new bar is formed only when the price moves a predefined amount. If the price moves less, the bar is not created and the movement is added to the current bar.
Time-elimination: The time it takes for the price to move to form a bar can range from seconds to hours, depending on market volatility..
Advantages
Price Focus: Allows you to focus on price movements without the distraction of charts cluttered with bars of varying lengths.
Trend Clarity: Makes trends clearer and easier to identify.
Risk Management: Because they are all the same point size, they facilitate planning exits, stops, and profit targets.
Flexibility: Traders can adjust the range size to suit their needs and the asset being traded.
Disadvantages
Loss of time information: Information about when events occurred is completely discarded.
Complex reconstruction: Chart reconstruction may require the availability of all price ticks (individual quote data), especially if they are being generated derivatively.
SP500 RANGE BARS THIS WEEK
Re: TREND FOLOWING
15It seems like the screenshots posted in this theard dont show up on the firefox browser somehow. Maybe consider saving them in another image format
Re: TREND FOLOWING
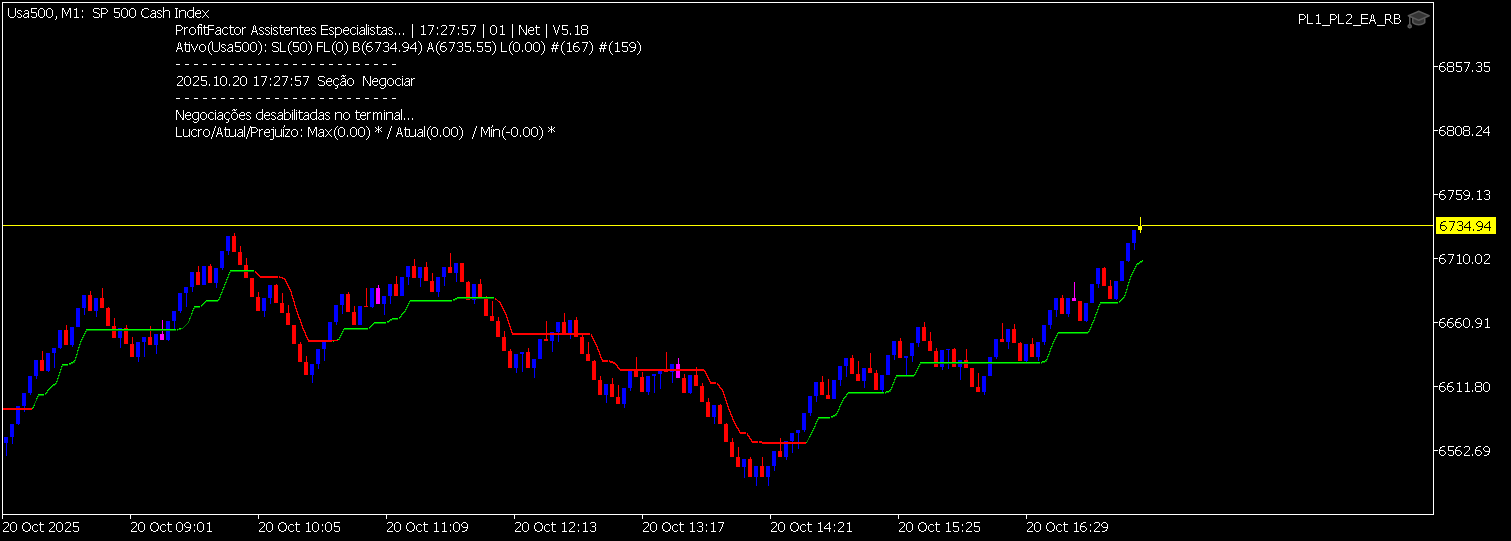
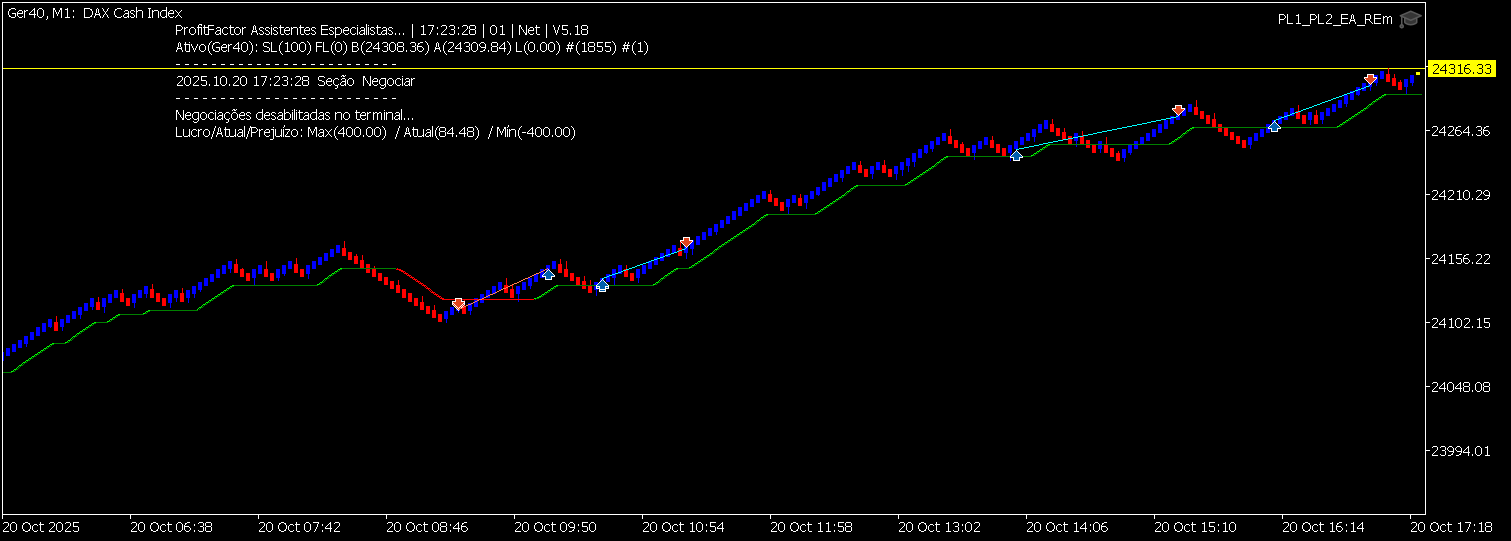
16SP500 UPDATE 20/10/2025PROFITLINEBR wrote: Sat Oct 18, 2025 7:57 am RANGE BARS
Range bars are a type of market chart that ignores time and focuses solely on price movement. Each bar has the same height, set by the trader, and is only created when the price moves by a specific amount (the "range"). This makes them less cluttered and easier to identify trends than time-based charts
How they work
Price-based, not time-based: Unlike candlestick or line charts, which are influenced by time, range bars don't care how long an asset takes to move.
Fixed-size bar: A trader sets a specific size for the bar (e.g., 10 ticks or points).
New bar creation: A new bar is formed only when the price moves a predefined amount. If the price moves less, the bar is not created and the movement is added to the current bar.
Time-elimination: The time it takes for the price to move to form a bar can range from seconds to hours, depending on market volatility..
Advantages
Price Focus: Allows you to focus on price movements without the distraction of charts cluttered with bars of varying lengths.
Trend Clarity: Makes trends clearer and easier to identify.
Risk Management: Because they are all the same point size, they facilitate planning exits, stops, and profit targets.
Flexibility: Traders can adjust the range size to suit their needs and the asset being traded.
Disadvantages
Loss of time information: Information about when events occurred is completely discarded.
Complex reconstruction: Chart reconstruction may require the availability of all price ticks (individual quote data), especially if they are being generated derivatively.
SP500 RANGE BARS THIS WEEK
Re: TREND FOLOWING
18I have been using the Google Chrome browser... please test if it works with it.Abdi wrote: Tue Oct 21, 2025 12:50 am It seems like the screenshots posted in this theard dont show up on the firefox browser somehow. Maybe consider saving them in another image format
Re: TREND FOLOWING
19Yes, i saw that it works with chrome and brave for example.PROFITLINEBR wrote: Tue Oct 21, 2025 2:34 am I have been using the Google Chrome browser... please test if it works with it.
Just wanted to let you know, when people use firefox they wont see any of your images.
Re: TREND FOLOWING
20Thanks for the heads up AbdiAbdi wrote: Tue Oct 21, 2025 5:23 am Yes, i saw that it works with chrome and brave for example.
Just wanted to let you know, when people use firefox they wont see any of your images.
- These users thanked the author PROFITLINEBR for the post:
- Abdi
- Rating: 0.6%
