Products or services listed here are not affiliated with or endorsed by Forex-station, unless explicitly stated.

DownloadTREND FOLOWING

1
My name is Marcelo Sampaio, I'm from Brazil, I'm 46 years old, and I've been studying trend following for over 20 years. During this time, my partner, Charles Adriano, and I have developed, tested, and improved trading tools based on the trend following methodology and philosophy. We strive to translate the powerful concepts of trend following into simple terms and integrate these concepts and pillars into the tools we develop, namely:

- Operational Discipline

- Risk Management

- Consistent Method.

We will soon be offering Trade Assistant and Expert Advisor versions.

Why Trend Following?


Trend Following is a strategy that captures market trends without predicting the future—it simply goes with the flow. But why do you believe this? Because these giants don't just talk the talk; they walk the walk. They manage billions in assets for institutional investors, pension funds, and high-net-worth individuals. Their returns aren't luck: they're the result of systems tested in crises like the 1987 crash, the 2000 dot-com bubble, the 2008 Great Recession, and even the post-pandemic volatility of 2020-2022. According to studies by Société Générale and AQR Capital, Trend Following funds have delivered average annualized returns of 10-15% over the past 30 years, outperforming indexes like the S&P 500 during periods of turbulence. Now, let's get to the masters—get ready to be inspired!

1. Ed Seykota: The Pioneer of Emotional Discipline and Legendary Returns
Ed Seykota is often called the "father of modern trend following." He began in the 1970s developing computerized systems to capture trends in commodities. As the mentor of the famous Turtle Traders (an experiment that turned novice traders into millionaires), Seykota emphasizes operational discipline—one of the pillars of our Profitline.

Historical Returns: Impressive! From 1972 to 1988, his system delivered annualized returns of approximately 250% on an initial $5,000 account, turning it into millions (as reported in books such as Jack Schwager's "Market Wizards"). Throughout his career, average annual returns hovered around 20-30%, with drawdowns controlled thanks to rigorous risk management. In 2008, during the financial crisis, his systems captured downtrends, generating profits as the market collapsed.
Lesson for you: Seykota proves that trend following overcomes emotional bias. "Cut losses short and let profits run" – a mantra that Profitline automates for beginning traders.

2. Richard Dennis: The Creator of the Turtle Traders and Master of the Consistent Method
Richard Dennis, nicknamed the "Prince of the Pit" (due to his success on Chicago trading floors), is a legend who bet that trading could be taught. In 1983, he trained a group of "Turtles" in Trend Following, proving that a consistent method can be replicated.

Amount Under Management (AUM): Dennis managed funds that peaked at $200 million in the 1980s, but his legacy extends to firms influenced by him, indirectly totaling billions.
Historical Returns: The Turtles generated cumulative returns of over 80% per year on average during the experiment (1984-1988), with some years reaching 100-200%. Dennis personally turned $400 into $100 million in a decade. Even after retirement, his approach influenced funds with long-term annualized returns of 15-25%, according to CTA Intelligence analysis.
Imagine applying this: Profitline incorporates Turtle-like rules, a consistent method that anyone can follow—without years of training.

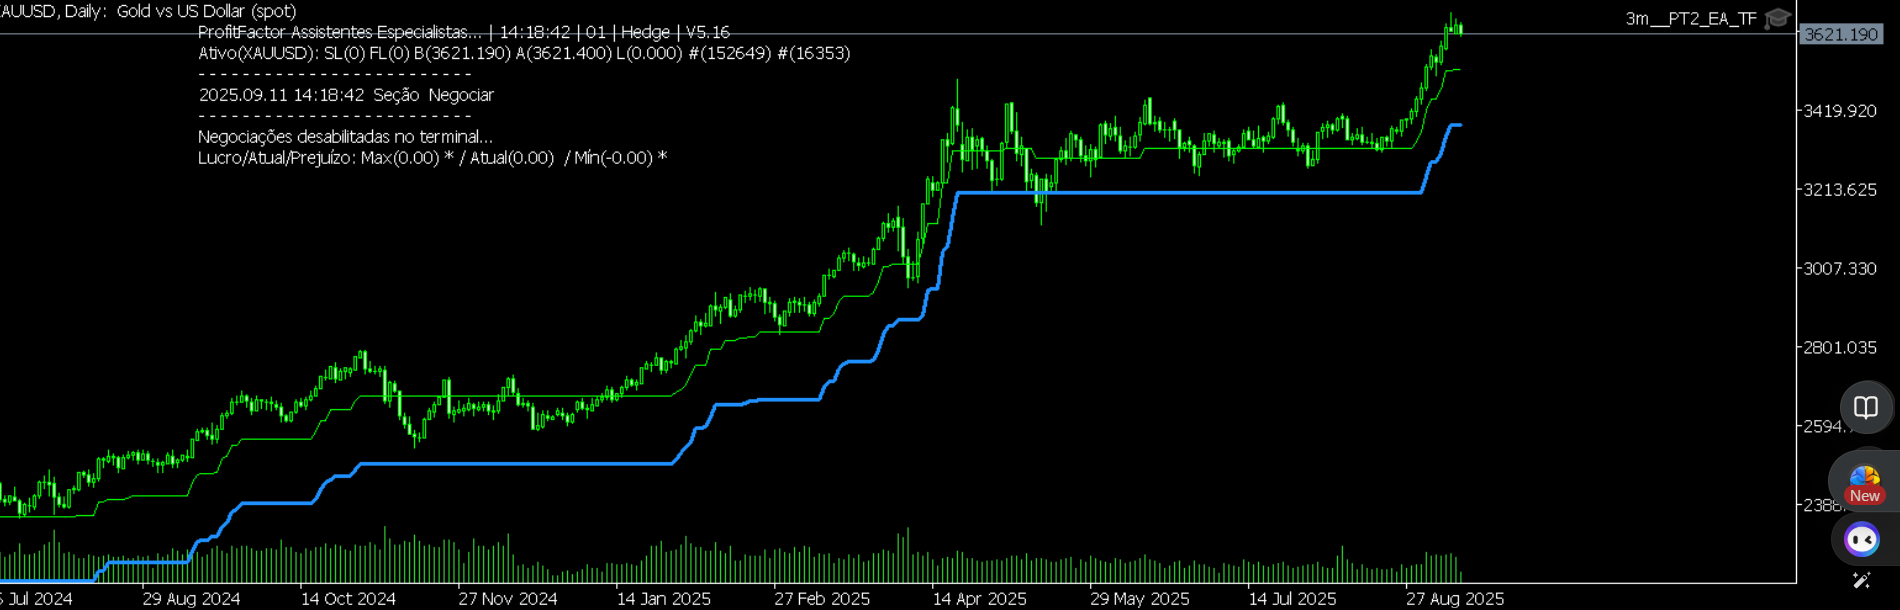
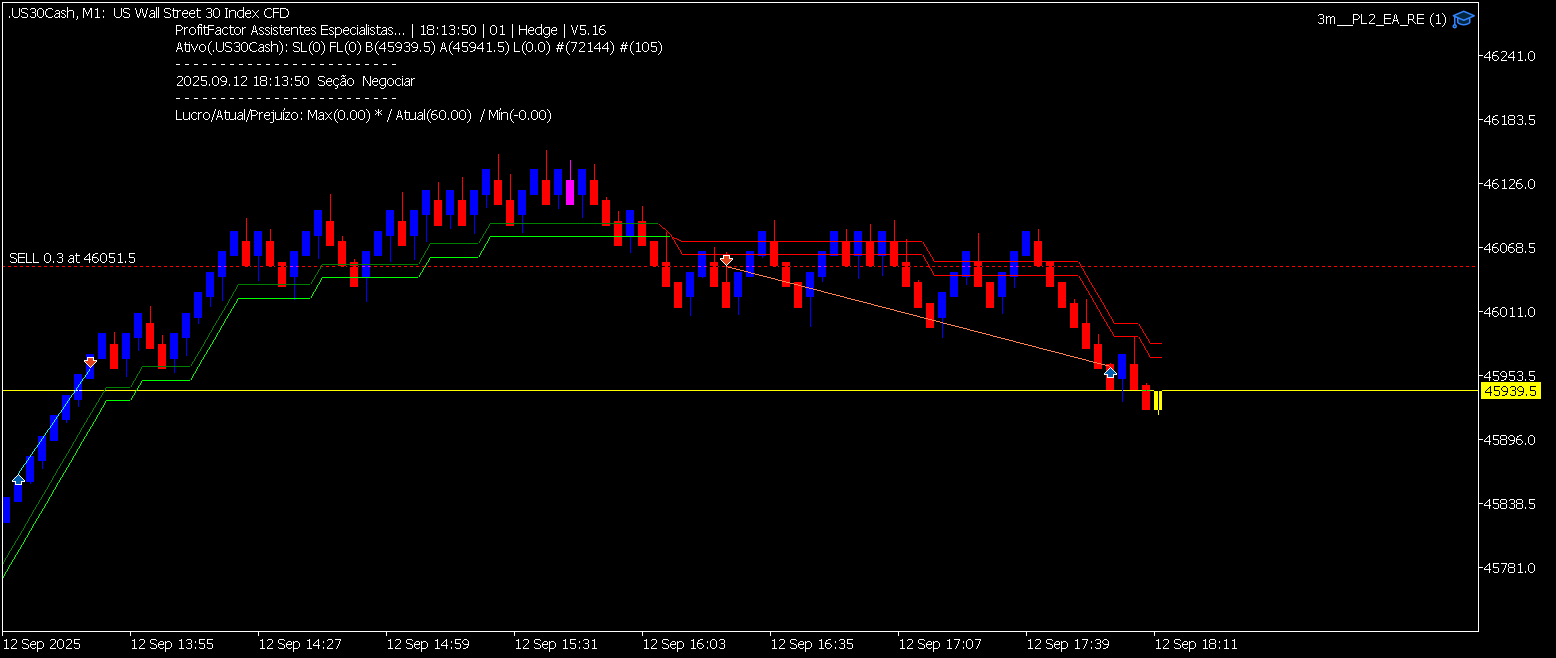
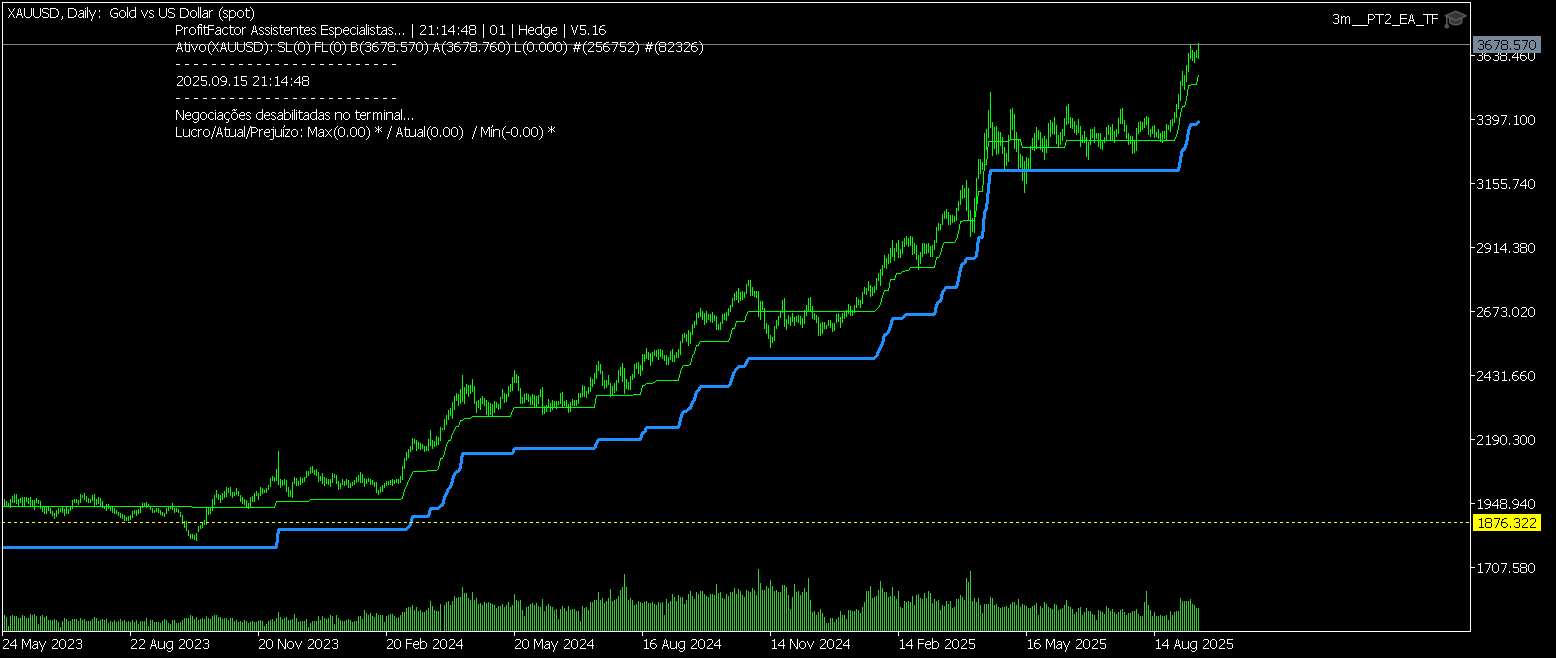
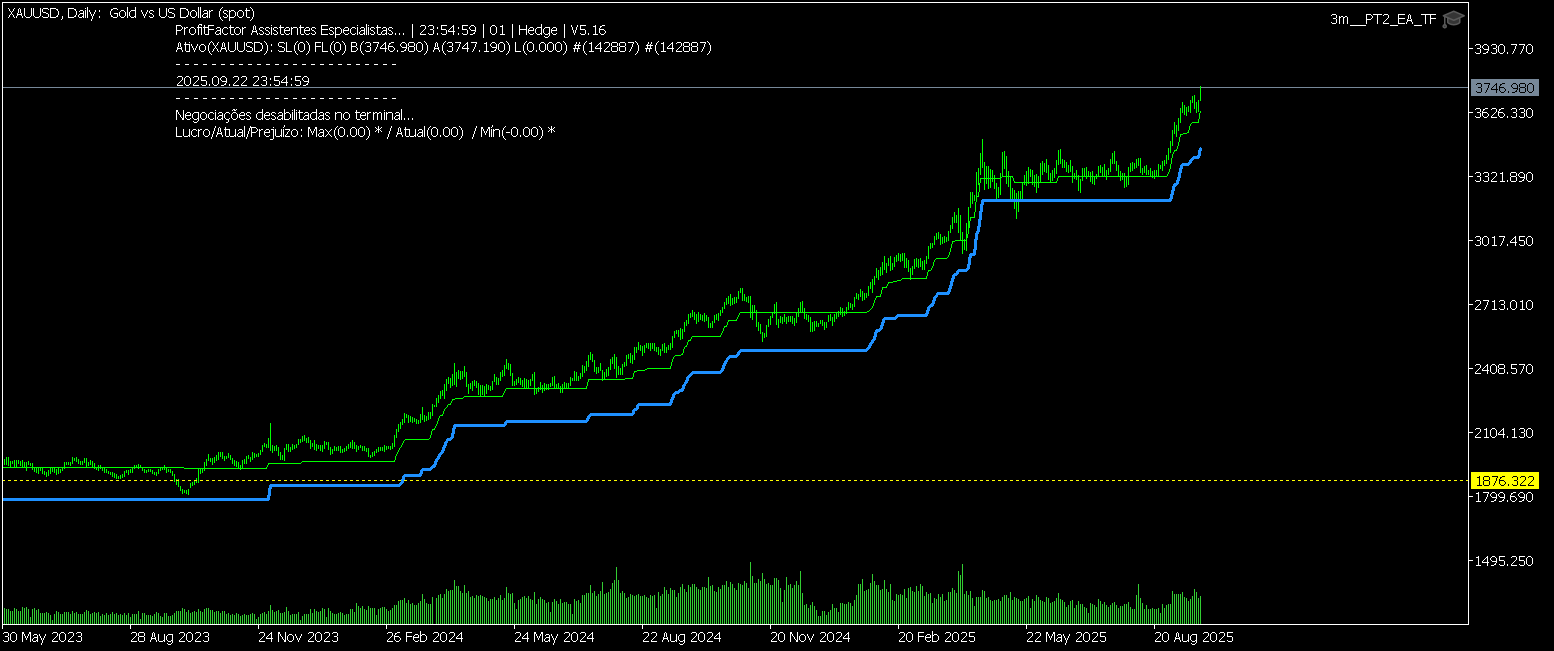
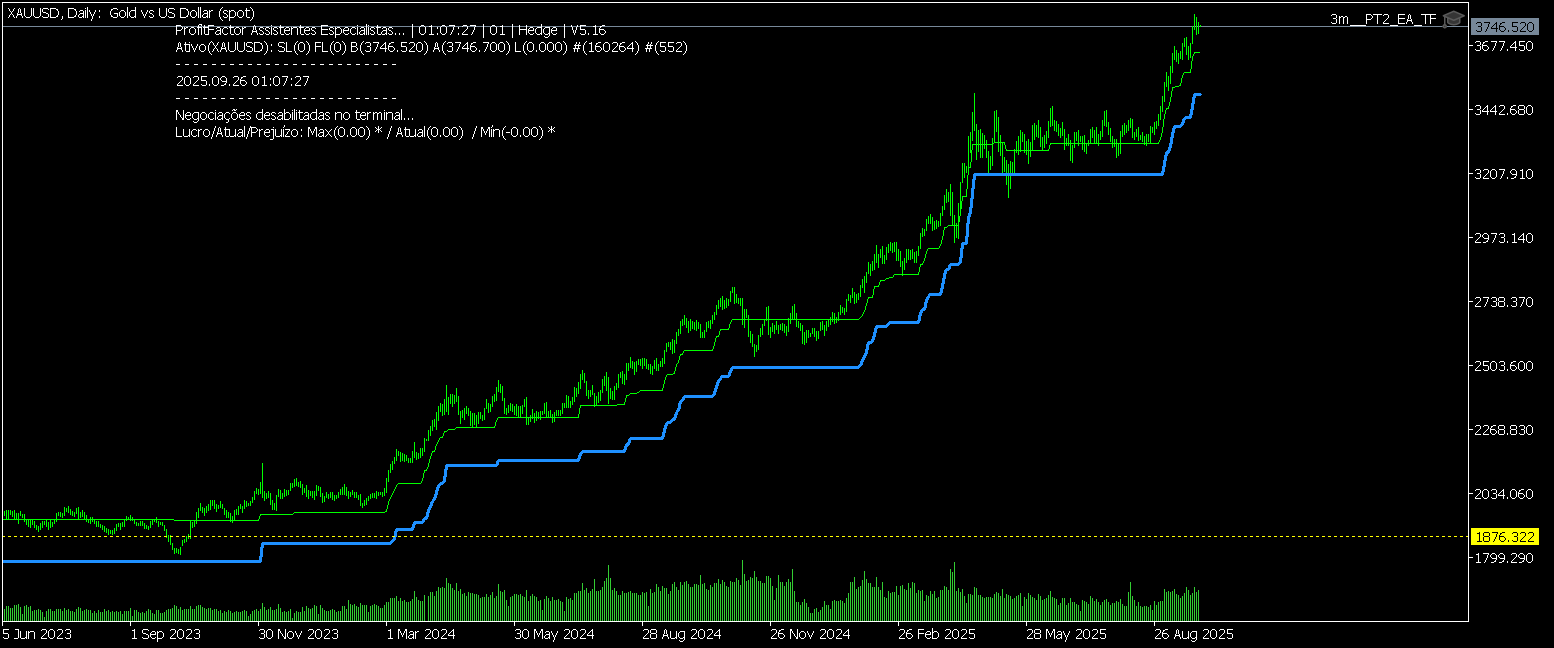
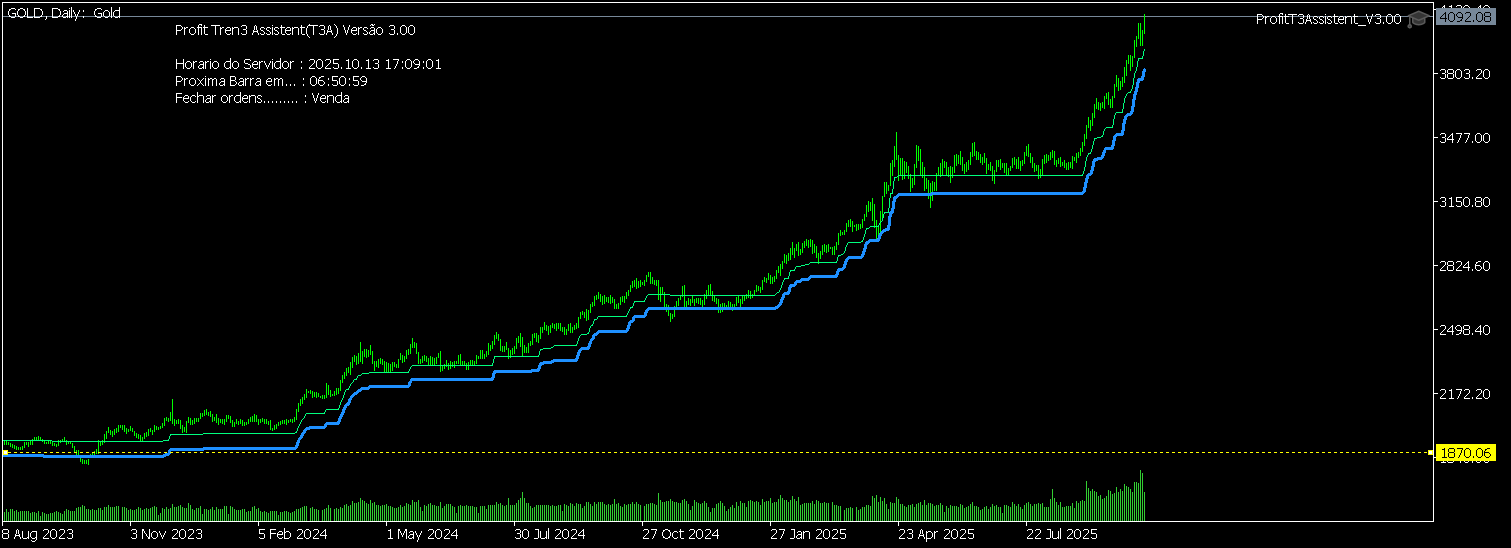
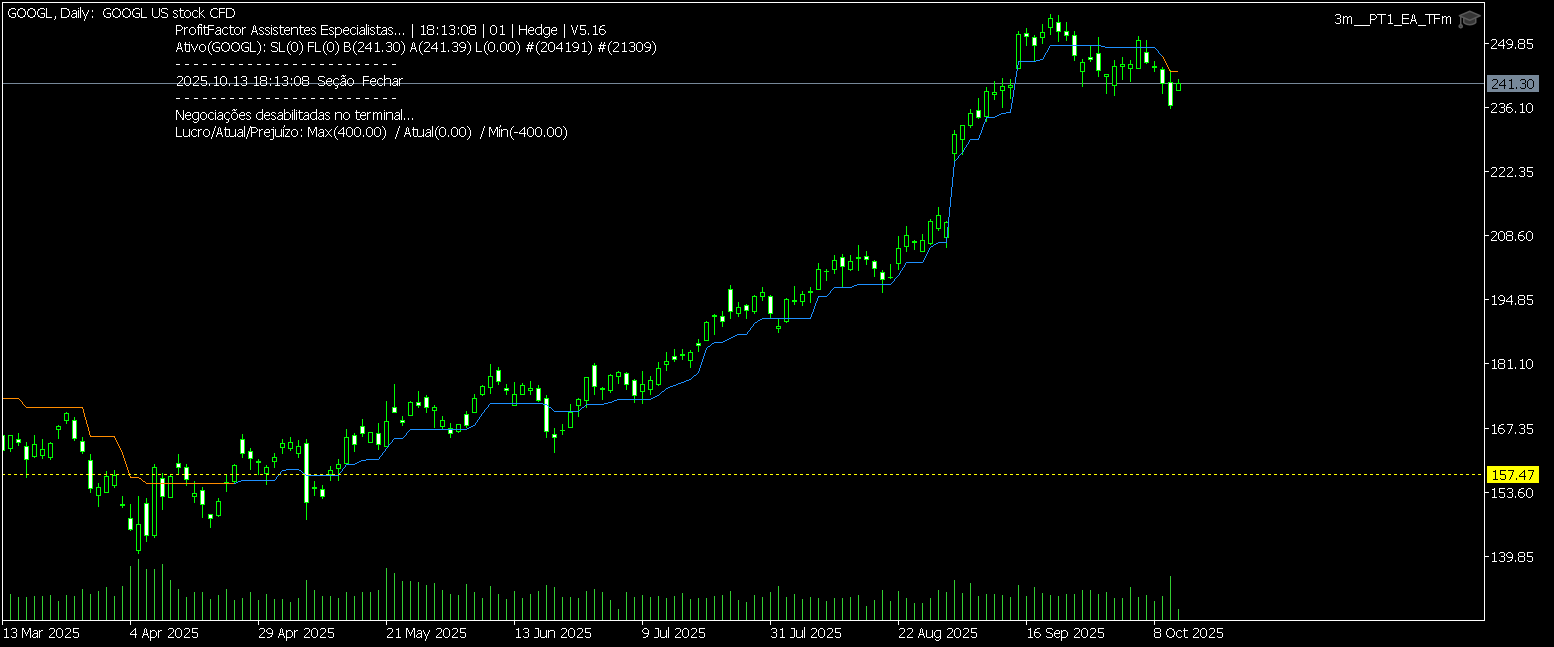
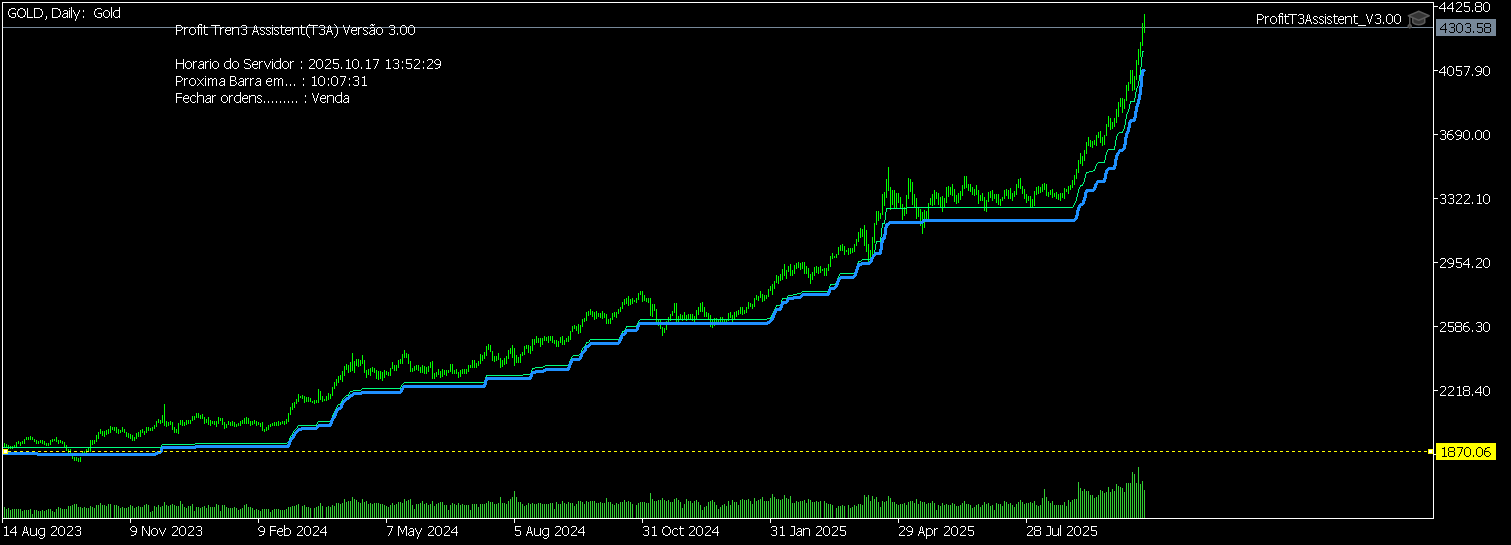
Below are some graphs from our Trading Assistant. It does not open orders, it controls the orders you place and manages these orders by making partial executions or stopping when the lines change color.
the daily Gold Chart
Image


Re: TREND FOLOWING

2
Trend following is a trading approach based on the premise that asset prices tend to move in persistent trends—up (bullish), down (bearish), or sideways (range-bound). Instead of trying to predict tops and bottoms, the trader "follows" the established trend, entering positions in the direction of the prevailing momentum and exiting when there are signs of a reversal. Common tools include moving averages, trend lines, MACD, or ADX to gauge trend strength.

This strategy is popular among institutional and long-term traders, such as the famous "Turtles" trained by Richard Dennis in the 1980s, who used simple rules to capture trends in commodities. The mantra is: "Cut your losses short and let your winners run." However, its effectiveness depends heavily on the visualization tool, and that's where Renko charts come in.

Unlike traditional candlestick or bar charts, which are time-based (e.g., one candle per hour or day), Renko charts are constructed purely based on price movements. Each "block" or "brick" represents a fixed price movement (e.g., $1 or 1% of the asset's value), regardless of the time it takes for that movement to occur.

How does it work? If the price rises by a defined amount (e.g., 10 pips in forex), a green (or white) brick is added. If it falls, a red (or black) brick is added. There are no bricks if the price fluctuates within the limit – this filters out market "noise."

Origin: Renko comes from the Japanese "renga" (brick) and is a variation of Point & Figure charts, popularized in Western trading in the 1990s with the advent of platforms like MetaTrader. Now, imagine combining this with trend following: you follow cleanly visualized trends, without the distractions of smaller fluctuations or arbitrary time intervals. This leads to a number of advantages that make this combination powerful. Let's explore them in detail.


Integrating trend following with Renko amplifies the strengths of both, creating a robust system for identifying and capitalizing on trends. Here are the key advantages, explained in depth and with examples.

1. Noise Filtering and Focus on Significant Movements
One of the biggest advantages is the ability of Renko charts to eliminate market noise, allowing trend following to focus only on real, sustainable trends.

Detailed Explanation: On traditional timeframe charts, such as 5-minute candlesticks, the price can fluctuate randomly due to minor news, low liquidity, or manipulation, generating false trend signals. Renko ignores this: it only adds bricks when there is a pre-defined price movement (the "brick size"). This means that trends in trend following are confirmed only by substantial changes, reducing whipsaws (false breakouts).
Below is an example of TREND FOLOWING INTEGRATED WITH RENKO Dow Jones chart
Image