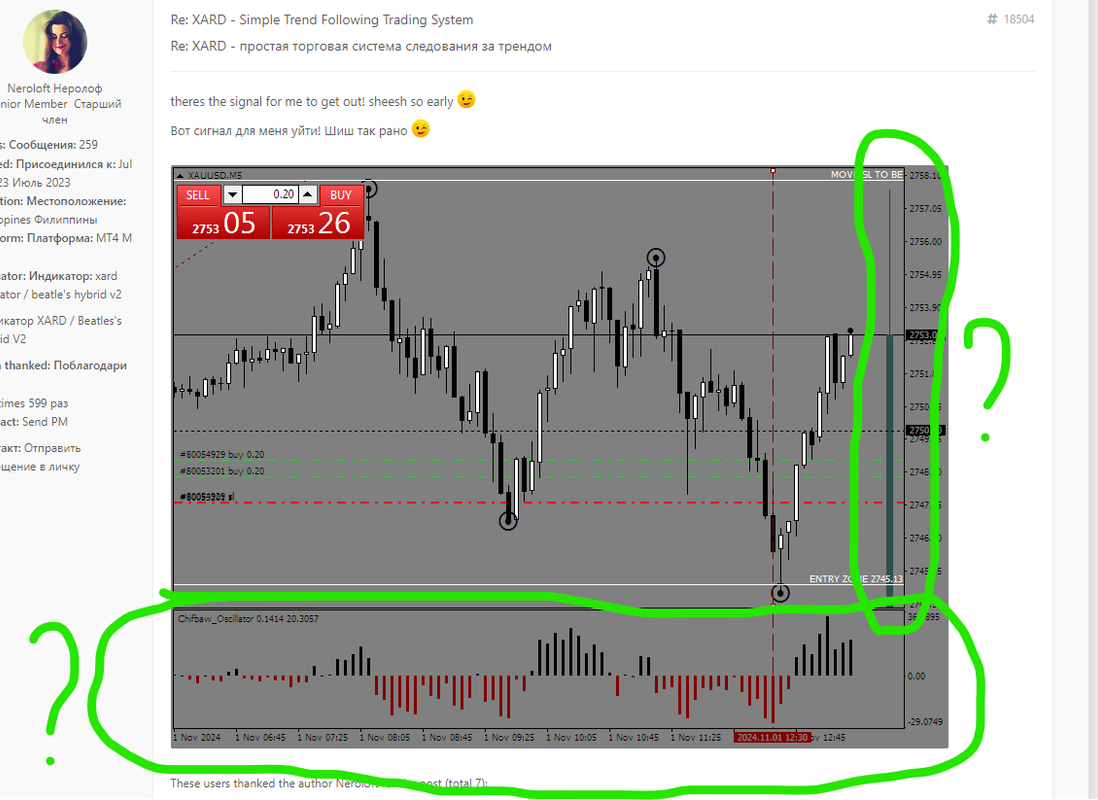
alloushforex wrote: Fri Nov 01, 2024 4:02 am
Hello traders,
I have been a silent reader for a year. I started trading on a demo account 3 years ago, and I have tried price action, SMS, and everything else; nothing has worked. I want to thank XARD and everyone else for this wonderful trading system.
My problem is that I still don’t fully understand it after a year. Let me explain my issue:
I use the Xu68 version on MT5 on the M1 chart.
1. I check the H4 chart to see the trend direction; for example, if there is an upward arrow, a blue dot, or a green dot—all these indicators signify an upward trend, perfect.
2. Then I switch to the M1 chart and wait for an upward arrow to appear and go long from the 2nd large dot (the blue one) when the candle closes above the EMA line (EMA or SMA, I’m not sure which is being used).
My problems are: on the H4 chart, when a large blue dot appears, I could theoretically go long on the M1 chart according to the requirements, BUT the blue dot does not stay where it is; it shifts down candle by candle on the H4 chart, eventually stabilizing before it goes back up. This is what you all call recalculating. This means that if I assume that an upward trend is starting on the H4 chart but the blue dot keeps moving down, while I am set to go long on the M1, I have a significant problem.
Do you understand what I mean?

I ask for help, thank you!
There's a mismatch in your timeframe pairing.
M1 and H4 are too far apart...(240x)
It's recommended to combine timeframes which are multiples of 2, 3, 4 apart.
This makes the process of chart analysis easier.
Let me explain:
When doing chart analysis, it's good practice to have different views of the Market...Short term, Medium term, Long term
Most retail Traders use only two, but some use three.
Institutional Traders use several multiples apart (High timeframe charts)
Typically, you'll see combinations of:
M1, M5, M15 (Multiple of 5, Multiple of 3)
M5, M15, M30 (3x, 2x)
M30, H1, H4 (2x, 4x)
H1, H4, D1 (4x, 6x)
H4, D1, MN1 (6x, 20x)
However, most retail Traders only use two timeframes (Short term, Long term)
M5, M15 (3x)
M30, H1 (2x)
These combinations enable easy analysis of the chart.
For example, M5, M15, M30
The brain only processes
THREE 5min bars every 15 minutes...and only
TWO 15min bars every 30 minutes!
It's much easier to see what's happening.
However, when you combine M1 with H4
Here's what you're invariably doing.
Your brain is processing the OHLC (Open, High, Low, Close) of
240 1min bars every 4Hrs!
(1 x 60 x 4 = 240)
During this 4Hr duration, 1Min charts produce several High-Low cycles and it's extremely difficult to determine the Highest-high or Lowest-low between the bars.
You're constantly jumping in and out of trading positions.
The problem with this is, it leaves you confused and frustrated.
Contrast this with a Trader like me who trades the 30mins chart.
I only need to look at
TWO bars every hour!
Or a Trader who trades using H4 charts.
He only needs to do analysis using
SIX bars every day (24hrs).
The markets have been designed for lower timeframe charts to mostly go in a range and sometimes trade against the long term trend.
Hence why shorter timeframes are full of noise and have a very high failure rate when solely used for trading.