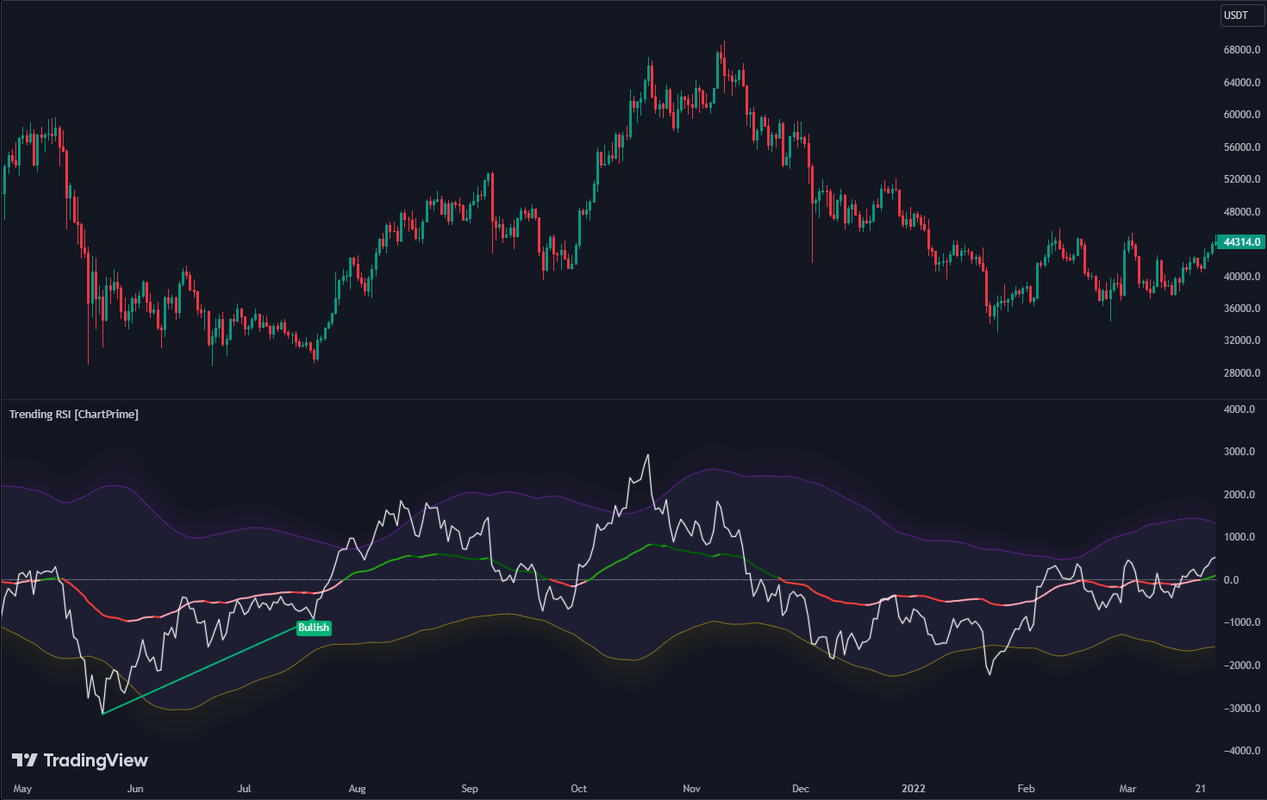
Name: Trending RSI
Link: https://www.tradingview.com/script/qe0D ... artPrime/
Utility: Trending RSI takes a new approach to RSI intended to provide all of the missing information that traditional RSI lacks. Questions such as "why does the price continue to decline even during an oversold period?" can be aided using the Trending RSI.
Code: Select all
// This Pine Script™ code is subject to the terms of the Mozilla Public License 2.0 at https://mozilla.org/MPL/2.0/
// © ChartPrime

//@version=5
indicator("Trending RSI [ChartPrime]", max_bars_back = 5000, timeframe = "", timeframe_gaps = true)

// Declarations {

type divergence_data
    bool pivot_found = false
    bool divergence_found = false
    bool polarity = na
    float level = na
    color colour = #00000000

method pivot_found(divergence_data self, bool direction, bool enable)=>
    bool flag = false

    if enable
        if direction
            flag := self.pivot_found and self.polarity
        else
            flag := self.pivot_found and not self.polarity
    else
        flag

method divergence_found(divergence_data self, bool direction, bool enable = true)=>
    bool flag = false

    if enable
        if direction
            flag := self.divergence_found and self.polarity
        else
            flag := self.divergence_found and not self.polarity
    else
        flag

in_range(bool condition, int lower_range, int upper_range) =>
    int bars = ta.barssince(condition)
    lower_range <= bars and bars <= upper_range

find_divergence(float source, int left, int right, int lower_range, int upper_range, color bullish_color, color bearish_color)=>
    float source_offset = source[right]
    int offset = -right

    bool pl = not na(ta.pivotlow(source, left, right))
    bool ph = not na(ta.pivothigh(source, left, right))

    bool source_hl = source_offset > ta.valuewhen(pl, source_offset, 1) and in_range(pl[1], lower_range, upper_range)
    bool price_ll = low[right] < ta.valuewhen(pl, low[right], 1)
    bool bullish_condition = price_ll and source_hl and pl

    bool source_lh = source_offset < ta.valuewhen(ph, source_offset, 1) and in_range(ph[1], lower_range, upper_range)
    bool price_hh = high[right] > ta.valuewhen(ph, high[right], 1)
    bool bearish_condition = price_hh and source_lh and ph

    divergence_data ret = divergence_data.new()

    if bullish_condition
        ret := divergence_data.new(true, true, true, source_offset, bullish_color)
    else if pl
        ret := divergence_data.new(true, false, true, source_offset, bullish_color)

    if bearish_condition
        ret := divergence_data.new(true, true, false, source_offset, bearish_color)
    else if ph
        ret := divergence_data.new(true, false, false, source_offset, bearish_color)

    ret

convolve(float[] weights, float[] kernel, int iterations)=>
    var float[] convolution = weights.copy()

    if iterations > 0
        if barstate.isfirst
            for iteration = 0 to iterations - 1
                float[] temp = array.new<float>()

                for i = 0 to convolution.size() + kernel.size() - 2
                    float sum = 0.0

                    for j = 0 to kernel.size() - 1
                        int index = i - j

                        if index >= 0 and index < convolution.size()
                            sum += convolution.get(index) * kernel.get(j)
                        else
                            continue

                    temp.push(sum)

                convolution := temp.copy()

    convolution

method truncate_weights(float[] weights, bool enable = true)=>
    if enable
        int max_idx = weights.indexof(weights.max())

        if max_idx > 0
            for i = 0 to weights.indexof(weights.max()) - 1
                weights.shift()
        else
            weights

    weights

binomia_ma(float source, int length, bool enable)=>
    float pre_filter = ta.sma(source, 2)
    float[] h = array.from(0.5, 0.5)
    float[] weights = convolve(h, h, length * 10 - 1).truncate_weights()

    if enable and not na(source)
        float sum = 0
        float weight = 0

        for i = 0 to math.min(weights.size() - 1, bar_index)
            float w = weights.get(i)
            weight += w
            sum += nz(pre_filter[i], nz(source[i])) * w

        sum/weight

    else
        float(na)

precalculate_phi_coefficients(simple int length, simple float phase)=>
    var float[] coefficients = array.new<float>(length)
    var float E = 0.0

    const float SQRT_PIx2  = math.sqrt(2.0 * math.pi)
    const float MULTIPLIER = -0.5 / 0.93
    var int   length_1 = length - 1
    var float length_2 = length * 0.52353
    if barstate.isfirst
        for int i=0 to length_1
            float alpha = (i + phase - length_2) * MULTIPLIER
            float  beta = 1.0 / (0.2316419 * math.abs(alpha) + 1.0)
            float   phi = (math.exp(math.pow(alpha, 2) * -0.5)
                          *-0.398942280) * beta *
                          ( 0.319381530  + beta *
                          (-0.356563782  + beta *
                          ( 1.781477937  + beta *
                          (-1.821255978  + beta
                          * 1.330274429)))) + 1.011
            if alpha < 0.0
                phi := 1.0 - phi
            float weight = phi / SQRT_PIx2
            E += weight
            coefficients.set(i, weight)
    [coefficients, E]

phi_smoother(series float source, series float[] coefficients, series float E, simple float hf_ratio = 0.5)=>
    float sma2 = source * math.min(math.max(0.5, hf_ratio), 1) + nz(source[1], source) * math.max(math.min(0.5, 1 - hf_ratio), 0)
    int length = coefficients.size()
    if length > 1
        float W = 0.0
        for int i=0 to length - 1
            float weight = coefficients.get(i)
            W  += weight * sma2[i]
        W / E
    else
        source

rma(float source = close, float length = 9)=>
    float alpha = 1 / length
    var float smoothed = na
    smoothed := alpha * source + (1 - alpha) * nz(smoothed[1])

rsi(float source, int length)=>
    float up = math.max(source - source[1], 0)
    float down = math.max(source[1] - source, 0)
    float rs = rma(up, length) / rma(down, length)
    float rsi = 100 - 100 / (1 + rs)
    rsi

reverse_rsi(series float source, simple int length, float value)=>
    float src = (source - ta.rma(source, length)) / (length / 2)
    float alpha = 1 / length
    float average_up_count = 0.0
    float average_down_count = 0.0

    average_up_count := src > src[1]
                                     ? alpha * (src - src[1]) + (1 - alpha) * nz(average_up_count[1], 1)
                                     : (1 - alpha) * nz(average_up_count[1], 1)

    average_down_count := src > src[1]
                                     ? (1 - alpha) * nz(average_down_count[1], 1)
                                     : alpha * (src[1] - src) + (1 - alpha) * nz(average_down_count[1], 1)

    float reversed_value = (length - 1) * (average_down_count * value / (100 - value) - average_up_count)
    float reverse_rsi = reversed_value >= 0 ? src + reversed_value : src + reversed_value * (100 - value) / value

// }

// Inputs {

const string group_1 = "Settings"
const string top_value_tip = "Pick what RSI value you want the top range to represent."
const string bottom_value_tip = "Pick what RSI value you want the bottom range to represent"

float source = input.source(close, "Source", group = group_1)
int length = input.int(14, "Length", minval = 1, group = group_1)
float top_value = input.float(70, "Top Range", minval = 50, maxval = 99, tooltip = top_value_tip, group = group_1)
float bottom_value = input.float(30, "Bottom Range", minval = 1, maxval = 50, tooltip = bottom_value_tip, group = group_1)
bool ma_enable = input.bool(false, "MA Length        ", inline = "MA", group = group_1)
int ma_length = input.int(30, "", minval = 0, maxval = 100, inline = "MA", group = group_1)

const string group_2 = "Smoothing"
const string smoothing_tip = "Adjusts the period of the filter."
const string speed_tip = "Adjusts the responsiveness of the filter."
const string hf_tip = "Adjusts the pre smoothing of the filter." + "\n" + "1 is no pre smoothing while 0.5 is maximum pre smoothing."

int smoothing = input.int(1, "Signal Smoothing", minval = 1, tooltip = smoothing_tip, group = group_2)
float smoothing_phase = input.float(3.7, "Signal Smoothing Speed", tooltip = speed_tip, group = group_2)
float smoothing_hf = input.float(0.7, "Signal Smoothing Pre Filter", 0.5, 1, step = 0.1, tooltip = hf_tip, group = group_2)
int boundary_smoothing = input.int(40, "Boundary Smoothing", minval = 1, tooltip = smoothing_tip, group = group_2)
float boundary_smoothing_phase = input.float(3.7, "Boundry Smoothing Speed", tooltip = speed_tip, group = group_2)
float boundary_hf = input.float(0.5, "Boundary Smoothing Pre Filter", 0.5, 1, step = 0.1, tooltip = hf_tip, group = group_2)

const string group_3 = "Divergence"
const string left_tip = "Pick the lookback for the divergence."
const string right_tip = "Pick the lookforward for the divergence. This impacts the lag of the divergence. It acts as a confirmation period."
const string lower_range_tip = "Minimum number of candles for a divergence."
const string upper_range_tip = "Maximum number of candles for a divergence."

int left = input.int(15, "Look Left", minval = 1, tooltip = left_tip, group = group_3)
int right = input.int(15, "Look Right", minval = 1, tooltip = right_tip, group = group_3)
int lower_range = input.int(5, "Lower Range", minval = 1, tooltip = lower_range_tip, group = group_3)
int upper_range = input.int(60, "Upper Range", minval = 1, tooltip = upper_range_tip, group = group_3)
string divergence_label = input.string("Line", "Divergence Drawings", ["Line", "Label", "Line and Label"], group = group_3)
bool bullish_divergence = input.bool(false, "Enable Bullish Divergence", group = group_3)
bool bearish_divergence = input.bool(false, "Enable Bearish Divergence", group = group_3)

const string group_4 = "Color"
bool glow = input.bool(true, "Glow", group = group_4)
color rsi_color = input.color(#ffffff, "RSI", group = group_4)
color ma_color = input.color(#FFEE54, "MA Color", group = group_4)
color bg_color = input.color(#7E57C21A, "BG", group = group_4)
color top_color = input.color(#a222e283, "Upper Range", group = group_4)
color bottom_color = input.color(#e5b60c83, "Lower Range", group = group_4)
color center_bullish_up_color = input.color(#21a110, "Center", inline = "Center", group = group_4)
color center_bullish_down_color = input.color(#005e05, "", inline = "Center", group = group_4)
color center_bearish_up_color = input.color(#FCA0A9, "", inline = "Center", group = group_4)
color center_bearish_down_color = input.color(#FB3E38, "", inline = "Center", group = group_4)
color bullish_divergence_color = input.color(#00B374, "Bullish Divergence", group = group_4)
color bearish_divergence_color = input.color(#F03042, "Bearish Divergence", group = group_4)
color divergence_text_color = input.color(#FEFEFE, "Divergence Text", group = group_4)
color zero_line_color = input.color(#9E9E9E, "0 Line Color", group = group_4)

// }

// Calculations {

[smoothing_coefficients, smoothing_E] = precalculate_phi_coefficients(smoothing, smoothing_phase)
[boundary_coefficients, boundary_E] = precalculate_phi_coefficients(boundary_smoothing, boundary_smoothing_phase)

float top = phi_smoother(reverse_rsi(source, length, top_value), boundary_coefficients, boundary_E, boundary_hf)
float bottom = phi_smoother(reverse_rsi(source, length, bottom_value), boundary_coefficients, boundary_E, boundary_hf)
float center = phi_smoother(reverse_rsi(source, length, 50), smoothing_coefficients, smoothing_E, smoothing_hf)

float top_glow = phi_smoother(reverse_rsi(source, length, math.min(top_value + 4, 99)), boundary_coefficients, boundary_E, boundary_hf)
float bottom_glow = phi_smoother(reverse_rsi(source, length, math.max(bottom_value - 4, 1)), boundary_coefficients, boundary_E, boundary_hf)

float rsi = phi_smoother(reverse_rsi(source, length, rsi(source, length)), smoothing_coefficients, smoothing_E, smoothing_hf)
float ma = binomia_ma(rsi, ma_length, ma_enable)

divergence_data divs = find_divergence(rsi, left, right, lower_range, upper_range, bullish_divergence_color, bearish_divergence_color)

bool bullish_pivot_found = divs.pivot_found(true, bullish_divergence)
bool bullish_divergence_found = divs.divergence_found(true, bullish_divergence)
bool bullish_divergence_alert = divs.divergence_found(true)

bool bearish_pivot_found = divs.pivot_found(false, bearish_divergence)
bool bearish_divergence_found = divs.divergence_found(false, bearish_divergence)
bool bearish_divergence_alert = divs.divergence_found(false)

bool draw_line = str.contains(divergence_label, "Line")
bool draw_label = str.contains(divergence_label, "Label")

float center_delta = center - center[1]

// }

// Color Calculations {

color center_color = center >= 0
                                 ? (center_delta > 0 ? center_bullish_up_color : center_bullish_down_color)
                                 : (center_delta > 0 ? center_bearish_up_color : center_bearish_down_color)

color top_glow_color_max = color.new(top_color, 80)
color bottom_glow_color_max = color.new(bottom_color, 80)
color top_glow_color_min = color.new(top_color, 100)
color bottom_glow_color_min = color.new(bottom_color, 100)

color zero_line_solid = color.new(zero_line_color, 80)
color zero_line_dashed = color.new(zero_line_color, 50)

// }

// Plotting {

plot(0, "0 Line", zero_line_solid, display = display.pane)
plot(0, "0 Line", zero_line_dashed, 4, plot.style_histogram, display = display.pane)

top_band = plot(top, "Upper Range", top_color)
bottom_band = plot(bottom, "Lower Range", bottom_color)

top_band_glow = plot(glow ? top_glow : na, "Upper Range Glow", top_glow_color_min, editable = false, display = display.none)
bottom_band_glow = plot(glow ? bottom_glow : na, "Lower Range Glow", bottom_glow_color_min, editable = false, display = display.none)

fill(top_band_glow, top_band, top_glow, 0, top_glow_color_min, top_glow_color_max, "Upper Range Glow Fill")
fill(bottom_band, bottom_band_glow, 0, bottom_glow, bottom_glow_color_max, bottom_glow_color_min, "Lower Range Glow Fill")
fill(top_band, bottom_band, bg_color, "RSI Background Fill")

plot(glow ? center : na, "Center", color.new(center_color, 95), 3, editable = false, display = display.pane)
plot(glow ? center : na, "Center", color.new(center_color, 95), 2, editable = false, display = display.pane)
plot(center, "Center", center_color,2)

plot(glow ? ma : na, "MA Glow", color.new(ma_color, 95), 3, editable = false, display = display.pane)
plot(ma, "MA", ma_color, display = ma_enable ? display.all : display.pane)

plot(glow ? rsi : na, "RSI Glow", color.new(rsi_color, 95), 4, editable = false, display = display.pane)
plot(glow ? rsi : na, "RSI Glow", color.new(rsi_color, 95), 3, editable = false, display = display.pane)
plot(glow ? rsi : na, "RSI Glow", color.new(rsi_color, 95), 2, editable = false, display = display.pane)
plot(rsi, "RSI", rsi_color)

plot(bullish_pivot_found and draw_line ? divs.level : na, "Bullish Divergence", bullish_divergence_found ? divs.colour : #00000000, 2, offset = -right, display = bullish_divergence ? display.all : display.pane)
plotshape(bullish_divergence_found and draw_label ? divs.level : na, "Bullish Divergence Label", shape.labelup, location.absolute, bullish_divergence_found ? divs.colour : na, -right, "Bullish", divergence_text_color, display = bullish_divergence ? display.all : display.pane)

plot(bearish_pivot_found and draw_line ? divs.level : na, "Bearish Divergence", bearish_divergence_found ? divs.colour : #00000000, 2, offset = -right, display = bearish_divergence ? display.all : display.pane)
plotshape(bearish_divergence_found and draw_label ? divs.level : na, "Bearish Divergence Label", shape.labeldown, location.absolute, bearish_divergence_found ? divs.colour : na, -right, "Bearish", divergence_text_color, display = bearish_divergence ? display.all : display.pane)

// }

// Alerts {

alertcondition(ta.crossover(rsi, center), "RSI Cross Over Center")
alertcondition(ta.crossunder(rsi, center), "RSI Cross Under Center")
alertcondition(ta.crossunder(rsi, top), "RSI Cross Under Upper Range")
alertcondition(ta.crossover(rsi, top), "RSI Cross Over Upper Range")
alertcondition(ta.crossover(rsi, bottom), "RSI Cross Over Lower Range")
alertcondition(ta.crossunder(rsi, bottom), "RSI Cross Under Lower Range")
alertcondition(ta.crossover(rsi, ma), "RSI Cross Over MA")
alertcondition(ta.crossunder(rsi, ma), "RSI Cross Under MA")

alertcondition(ta.crossover(rsi, 0), "RSI Cross Over 0")
alertcondition(ta.crossunder(rsi, 0), "RSI Cross Under 0")
alertcondition(ta.crossover(center, 0), "Center Cross Over 0")
alertcondition(ta.crossunder(center, 0), "Center Cross Under 0")

alertcondition(ta.crossover(center_delta, 0), "Center Bullish")
alertcondition(ta.crossunder(center_delta, 0), "Center Bearish")

alertcondition(bullish_divergence_alert, "Bullish Divergence")
alertcondition(bearish_divergence_alert, "Bearish Divergence")

// }


