Yes the enter was in the green line
Re: A New Trading Game (chaos game) Played for Money and Played in Risk- Free Space
1152Trade Plan and Result for A Week
This is my trade report based on the forward planning we all did before the start of the week. My material results are attached. And in fact the strategy used and how the space is calculated before deciding the plan ahead were posted around the same time as the plan. If do not know what the plan was and how we agreed it, please page back to find the details. I expect anyone following and interested to be similarly able to show results in the days ahead - or else do not waste your time keep to the dance you know.
The Crow (_-_) Inverted
PS: The signals used cannot be clearer.
- Rating: 1.2%
Re: A New Trading Game (chaos game) Played for Money and Played in Risk- Free Space
1153Some people ask ------------> give us your step by step entry and I am like what? Can that be serious?
I am sure everyone here is beyond baby pips:
[a] I gave you an equality that i) tells you diagonal or direction ii) I then showed how to calculate risk-free space iii) I then showed you why ----> the dynamics are such that the fractal iterations are negative or positive. That the sign of the equality is the sign of fractal deviation and that if going down up pivots in the FLE translate lower and if up, down pivots translate higher.
I told that the idea in the mathematics is the displacement of a current low or high within a definition called a primitive. This primitive is a shape and in order to do the displacement price follows a fixed pattern and that the most complete shape of the market at all times is 6n. So any time you see a 6n pivot and signal changes trade it.
 Use the other properties of the space to follow the trade by employing the Screenface. So where exactly am I supposed give the step by step. The first thing you do is to calculate the turn and next the safe space and you can trade within that however you want subject to trading in the same direction as the current 6n pivot.

[d] I will show specific trades but only to discuss some other critical points such as for instance how news flow is handled, etc.

[e] Otherwise it is a model and not a trading system and if you do not recognize the above as step by step enough then clearly you need to go back to the books. Orbit Books and try to get it right or ask other folk. I think it is simple. Plus you got a system employ a conjoint strategy simple.


The Crow (-_-)


Or may be no need showing past trades then we show forward because in fact you treat news flow the same as regular moves and will explain the reasoning again (already done so before now)- Rating: 1.2%
Term Trades Section
1154Hello Orbitals...
In yesterday's private chat, Samm gave a very clear description of the meaning of the Therm Trades section, and most importantly, that it was done in a language that everyone could understand. I know that he has already given descriptions of the different sections of the tool, but let me quote it again. It was very helpful for me, maybe it will be useful for someone else...
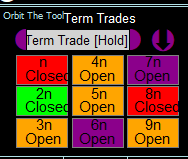
1. Term Trades (TT) defines space in terms of “volatility deviation” or the side to which volatility is directed. To explain, a positive diagonal for example has a rising slant (going up), but before it turned up it must have been going down.
2. So the TT colour would have been DarkOrchid with the letters “Open,” implying that volatility is driving price down in a cyclic trend. But a) when price turns up and strong enough to suggest at least a pullback, TT colour turns Green with the letters “Closed” implying buy orders have become dominant and the space is “closed” to sell orders.
3. So b) the logic of that is price is rising toward the boundary of the negative volatility envelope or space. If price reaches that current boundary and fails to “breakout” it must remain in negative space and so it turns to return to trend and we see a change from Green “closed” ----> back to DarkOrchid “Open” because we only had a pullback with price rising asymptotically to the edge of negative space without transforming the current space from negative to positive.
4. But on the other hand, in a reversal price must break that bound and where that is the case in this example, we would have price Green “closed” ---------> transformed to Gold “open” implying that price is now in positive space and trending up. So XAUUSD must have been trending up in 7n historically and then turned as if in a Pullback (red) and asymptotically approaching the lower end of its original space and therefore was “closed” to buy orders and sell orders dominate at the time I wrote that Strategy and you will see where I remarked, that at time of observation it was possible that price might breach the low boundary and “Open” negative space on 7n to sustain a cyclic down trend. And that is exactly what has happened in Gold
5. This is why the Spot Trend command is so powerful and certain. Spot Trend = change in TT + change in Cyclicality to the same colour which transforms the space to the colour of the equality. And because markets define iterative spaces (just like in compound interest), in negative space high pivots translate price lower and in positive space low pivots translate price higher and in both cases along the a given diagonal which is why we say price is phase locked to that current diagonal and which is why this setup defines risk-free space since even without a stop loss any entry will persist in one and only one direction.
And one more thing about reversals... I think it's also very valuable. At least I believe that it is necessary to use the tool in this way. Again very affordable...
This is how you read reversals.
1. Cy =TT = diagonal = Cyclic trend.
2. On that command if going up AB is phase locked and if going down BC is phase locked.
3. Risk-Free space = AB if going up and BC if down (in other words all low pivots translate if AB and all high pivots translate to lows if BC.
4. Reversal is the change from BC to AB or vice versa using command 1 here.
5. So very difficult for me to understand since these are true 100/100 times. I do not know this idea of clogging up the space with confluence of so called “support and resistance lines” because logically 1 – 4 simplifies all that and has NEVER failed. I know as a “technical” trader you are used to trading traditional concepts. But that is not what I am promoting. Because this idea of confluence as for me has no basis in reality or fact. You have not seen 1 -4 fail a single time in life and in a million years that is how the market works and I can bet that you can NEVER EVER show a fail case ever. So please I really do not understand and I cannot support what does not make sense at all. I hope you understand.
Hope this information was helpful...
In yesterday's private chat, Samm gave a very clear description of the meaning of the Therm Trades section, and most importantly, that it was done in a language that everyone could understand. I know that he has already given descriptions of the different sections of the tool, but let me quote it again. It was very helpful for me, maybe it will be useful for someone else...
1. Term Trades (TT) defines space in terms of “volatility deviation” or the side to which volatility is directed. To explain, a positive diagonal for example has a rising slant (going up), but before it turned up it must have been going down.
2. So the TT colour would have been DarkOrchid with the letters “Open,” implying that volatility is driving price down in a cyclic trend. But a) when price turns up and strong enough to suggest at least a pullback, TT colour turns Green with the letters “Closed” implying buy orders have become dominant and the space is “closed” to sell orders.
3. So b) the logic of that is price is rising toward the boundary of the negative volatility envelope or space. If price reaches that current boundary and fails to “breakout” it must remain in negative space and so it turns to return to trend and we see a change from Green “closed” ----> back to DarkOrchid “Open” because we only had a pullback with price rising asymptotically to the edge of negative space without transforming the current space from negative to positive.
4. But on the other hand, in a reversal price must break that bound and where that is the case in this example, we would have price Green “closed” ---------> transformed to Gold “open” implying that price is now in positive space and trending up. So XAUUSD must have been trending up in 7n historically and then turned as if in a Pullback (red) and asymptotically approaching the lower end of its original space and therefore was “closed” to buy orders and sell orders dominate at the time I wrote that Strategy and you will see where I remarked, that at time of observation it was possible that price might breach the low boundary and “Open” negative space on 7n to sustain a cyclic down trend. And that is exactly what has happened in Gold
5. This is why the Spot Trend command is so powerful and certain. Spot Trend = change in TT + change in Cyclicality to the same colour which transforms the space to the colour of the equality. And because markets define iterative spaces (just like in compound interest), in negative space high pivots translate price lower and in positive space low pivots translate price higher and in both cases along the a given diagonal which is why we say price is phase locked to that current diagonal and which is why this setup defines risk-free space since even without a stop loss any entry will persist in one and only one direction.
And one more thing about reversals... I think it's also very valuable. At least I believe that it is necessary to use the tool in this way. Again very affordable...
This is how you read reversals.
1. Cy =TT = diagonal = Cyclic trend.
2. On that command if going up AB is phase locked and if going down BC is phase locked.
3. Risk-Free space = AB if going up and BC if down (in other words all low pivots translate if AB and all high pivots translate to lows if BC.
4. Reversal is the change from BC to AB or vice versa using command 1 here.
5. So very difficult for me to understand since these are true 100/100 times. I do not know this idea of clogging up the space with confluence of so called “support and resistance lines” because logically 1 – 4 simplifies all that and has NEVER failed. I know as a “technical” trader you are used to trading traditional concepts. But that is not what I am promoting. Because this idea of confluence as for me has no basis in reality or fact. You have not seen 1 -4 fail a single time in life and in a million years that is how the market works and I can bet that you can NEVER EVER show a fail case ever. So please I really do not understand and I cannot support what does not make sense at all. I hope you understand.
Hope this information was helpful...
- These users thanked the author ImpLaNT for the post (total 5):
- Darkdoji, Meyney, Chickenspicy, Jackson Doh, Mundu19
- Rating: 2.9%
Re: A New Trading Game (chaos game) Played for Money and Played in Risk- Free Space
1155Trade Control
The diagrams below show how simple Orbit Logic is executed correct 100/100 times in each case. Price is either going up or down at any time.
The primary equality commands are shown as A, B and C. A is Cyclic up or down, B is pullback (within the cyclic trend) and C is reversal.
When A, B or C = True: We use Range Arrow + Spot Trades Arrow (RA + SA)
within ()A, B or C
Structure of commands:
This means you have a nested structure of trade commands
TT+ CY = = Diagonal == Cyclic Trend == Risk-Free Space = {Level 1 Command}
Within Risk - Free space
H1 + H4 Match + {RA + SA} = = Spot Trades {Level 2 Command}
So a User can trade from any time frame subject to command structure so it is a very simple set up and the diagrams below should be read with the above explanation in mind. Very simple to learn and use. Requires no teacher but does require practice or demo trading.
The Crow (_-_) Inverted
PS: Time frame is really a meaningless concept in market dynamics. There is only a single move (Sequence) per period in space. Time frames give perspectives of this single sequence according to resolution or market window that a user selects to view the single movement or sequence. So we are merely looking at the same behaviour within n – 6n and 6n is motive because it has the most complete picture of all market movement (it accumulates all the fluctuations n – 5n) and is therefore the intraday cycle. We are trading cyclicality (aperiodic cyclicality). So using the system of pivots we use we can trade from any time frame (given 5n and 6n semaphores match), and we have a signal change whether a Level 1 or Level 2 command.
- These users thanked the author Darkdoji for the post (total 4):
- ImpLaNT, Meyney, Chickenspicy, Mundu19
- Rating: 2.3%
Re: A New Trading Game (chaos game) Played for Money and Played in Risk- Free Space
1156long or short?green line is long, red line is short we assume.
long seems to be to early; wait for the signs to align, short is risky because of the green dot 1H. yellow 1m low did not turn into magenta because the low was made on 27-9 (in hindsight but). 1H chart was clear: no shorts here; wait for proper up setup. Just my opinion about scalp setup 1M-1H. 15M added perhaps useful
Re: A New Trading Game (chaos game) Played for Money and Played in Risk- Free Space
1157I am a newbie to BTC and I want help from experts. So Orbit is different. I see BTC at a low stop. What do I do to trade it?
So at this time TT = Cy = negative, but page 12 tells us that the fracture is incomplete. This means we remain in continuation until an end of the structure which we know in advance by colour (a topological value).
However, There are only 3 possibilities (Orbit or no Orbit), a) price rises from the current low and displaces the crown M (5) onscreen or price rises to a lower High on an Aqua diagonal to return lower in a Spike Event, i.e. new lower low. Or price sustains in the FLE to continue immediately lower (though the FLE appears to have formed and from what immediate indications are showing, an immediate continuation is not on the cards, so looks like range play for now).
I know page 12 says whichever way the market goes from this point (current low), it is not a matter of prediction and nothing to get my underpants in a twist for, it is simply a matter of following the correct diagonal at the right time without being wrong even once. So what do I do? I do NOT want to lose even a cent. Thanks in advance to all Orbit experts and BTC experts. Anyone?
The Crow (_-_) Inverted
- These users thanked the author Darkdoji for the post (total 2):
- hesam-moon, Mundu19
- Rating: 1.2%
Re: A New Trading Game (chaos game) Played for Money and Played in Risk- Free Space
1158Frankly, I am confused about what direction you traded and from what level you traded and what your target was. I am also confused about what you said went wrong. Was the trade truncated? So not clear to me what the issues are so will give you general advice in addition to making an important remark on @Meney's advice.ItalianTrader wrote: Fri Aug 18, 2023 1:23 am Hello there,
I'm posting an old trade which went wrong ( made another high instead of making a low magenta). I would like to discuss on what could have been went wrong, so we all may grow and learn.
My view on the trade :
- Fractal pattern showed a pullback ongoing
-N signals aiming down
-M1 -H1 Matching (magenta to black arrow -->( or h4 matched with whitehead)
M1 perspective (Magenta high)
H1 perspective ( Black arrow )
Referring to the scalper manual, The only thing that come to my mind is that KSO n wasn't in Range position.
What do you think ?
Cheers
a) In order to trade Orbit at all, the very first thing you do is to calculate the diagonal on which you are trading. That is number 1 rule. How do you do such as complex calculation? From your screenshot Orbit Screenface shows TT (Red Closed) = Cyclicality (Red) = a negative diagonal for the entire market at the time of your trade whatever you traded. The complex calculation is simple and clear and tells you the market was directed down. It also tells you that the market was in a pullback up just before the down move in which you are trading etc.
b) So we have diagonal down and therefore from this fact the Risk-Free Space you had at the time of your trade was BC, which is from the top of the current diagonal to the final stop at a low (which was not yet reached at the time of your screenshot). This means that buys in the space give less pips then sells in the same space and since your Risk – Free Space is negative it is always better to look for pivots in FLE that selloff (that is highs translating to lows).
c) So where do you find such pivots? You go to 6n and a) if you see a low pivot in that space and the signal changes, that is (Range Arrow + Spot Trade), changes up you can risk a scalp up. Knowing you are a deterministic trader you are trading point to point which means 6n low – 6n high of the same Semaphore weight and given the space that you calculated is negative space you know that on new 6n high of equal weight as the low pivot, price is likely fall so you exit and wait for a signal at the same high to change down and you trade it down as another “scalp.”
d) That is the simplest and surest way to trade Orbit and does not matter whether you are scalping, swing trading or position trading the mechanism is the same for entry. In 6n all the matches from n - 6n are complete and correct and you can view this fact and that of direction most correctly or clearly from 6n because there is only a single sequence at a time for the entire market and it is a 6n sequence. There are no (M1, M5 or M15... markets have only one time frame and it is 6n), and going to M1, H1 etc does not give you enough information to trade surely and safely. Just because you think you are scalping the market does not make the market to change to fit your intentions so it is better to read your intentions against the market and that is done by reading the intraday cycle or 6n so you know begin and end of each sequence exactly.
e) Does this contradict the Scalping manual? Not at all but you start with this sense to learn and understand what the scalping manual means and when to do what it says correctly because if you did anything wrong it would be in the process of the translation of a 6n point to another 6n point whatever you did wrong. So begin with this simple advice and make sure you win all your trades that way then study how M1 (n) and H1 (5n) worked while you were “scalping” 6n correctly and then you become an expert scalper on 6n so that when next time you want to “scalp” any Time Frame as you did in your problematic trade, you will know exactly what to do with reference to your knowledge of 6n trading.
f) Understand the signalling structure a) we have level 1 or primary signals which helps you calculate trend and risk-free space (TT+CY). This should inform your choice of trades when and where you want to take them. b) Level 2 or secondary signals (RA + SA) which are trigger signals within the primary definition of the market from one 6n point to another 6n point. Note that unless a 6n translation is complete the other lower time frames feeding it are also incomplete and can behave in ways you do not expect because they are slaves to 6n and are merely trying to serve their master by working to get to where their master is going but only their master tells correctly where he is taking his slaves following him. That is how markets work.
g) The worst thing that can happen to your trading when “scalping” on 6n is that it is always possible that you may want scalp for just 200 points and price moves on your entry 2000 points in your direction and that may be a terrible thing for you, you might think. My advice? Subtract 200 points from your 2000 points result and return the value of 1800 points to your broker (since you merely wanted a scalp and not make so much money) – a joke but for good reason. Work with the market not fixed ideas about the market that you hear around (market noise). The market is a pattern you follow to be correct including the fact that the market is a 6n point to point translation.
h) Now let me briefly address @Meney’s advice. First we must thank him for his good grace. However, he gave you advice based on “technical” reasoning NOT chaos or deterministic trading. Notice that he “pierced the veil” of the MRI to do so by using MRI on a different template than the one displayed on the screenface. We do NOT use the MRI in that way in chaos. Why? It introduces severe riskiness into the trading space because in “technical” analysis they view the market as random and expect losses and actually provide for losses in all their trading design. In deterministic trading there is no reason for the trader to lose a trade and we do not provide or expect loses in trading. The reason is in the mathematics we use. The mathematics we use says “a deterministic system admits no randomness whatsoever in it’s future states”- and the market is a deterministic system. In other words, following our logic correctly and applying 6n point to point translations we do not expect a trader to lose because there is no reason for that (of course it happens but we do not provide for it nor do we expect it since a trader can improve on errors to the point of zero loss per period). But when you use the MRI as @Meyney suggested you introduce randomness because it may work sometimes and sometimes fail and that randomness affects your results because there is nothing in reality that justifies the lines Go Long and Go Short. They are heuristics based as in all of “technical” analysis, and not founded on our equation. But the translation of a 6n low point to 6n high point and vice versa are certainties they MUST happen (space is iterative and bijective not random at all). So while I am not saying it is incorrect I must state that it is NOT the way we use the MRI we use it for the shape of price and to locate activity either as folding or stretching and which is why you do not see those lines on the Screenface because they are random in effect and will cause losses rather than assure focus on the underpinning deterministic actions of the space you are trading. It introduces artificial fractures into a space that is already fractured according to a pattern and therefore must mislead. I hope @Mehney also appreciates the point made. We simply cannot mix “technical” analysis with chaotic analysis they are opposites by definition.
The Crow (-_-)
PS: Kindly respond in open forum a) If the points made were helpful b) if the ideas outlined are usable and implementable by you as stated and c) if every part of my response is clear and if not kindly say what part was unclear or disagreeable. Please respond in open forum for the sake of those others in the forum following this post of yours. Cheers and thank you for your active participation.
- Rating: 0.6%
Re: A New Trading Game (chaos game) Played for Money and Played in Risk- Free Space
1159I would like to focus minds of serious followers on how I trade and why or in other words how I think of and look at setups. I will do this by showing some trades I took next. So below is a special book for traders and trading Orbit. It is very good reference do use it.
Cheers
(-_-)
Cheers
(-_-)
- These users thanked the author Darkdoji for the post (total 4):
- Jackson Doh, ImpLaNT, Chickenspicy, Mundu19
- Rating: 2.3%
Re: A New Trading Game (chaos game) Played for Money and Played in Risk- Free Space
1160A few points to note in actual trades below
In screenshot A we see an indication that reads a “reversal” in the current cyclic trend in Gold. But within moments we see screenshot B reindicate a pullback up (the initial indication), this is part of what we call edge conditions. Which imply the various circumstances in which the behaviour of price describes trading at some extreme of the space in which it is trading. In this case, price is at the edge of negative space and persistence up would transform the space to positive space (low pivots translate higher) from negative space we had before (high pivots translate lower).This sort of flicking is associated with the intermittency that follows such conditions due to what chaos math calls Initial Conditions (the butterfly effect) at such edges. Intermittency is pervasive in market space therefore, but in the Cloud Version we have a setup that informs a user more directly about what is going on and how to control for this specific fluctuation type and the associated trade action.
In the prototype you use your eyes and your understanding of the play to control for trade action. Please see the new Orbit Trade Book page 14 for details. Note that an important quality of Orbit is that it times changes accurately and so we should exercise patience at these sort of points (when we become unsure and might make a trade error do NOT trade) – because when there is a final resolution of intermittency the signals will be firm and there will still be enough time to enter trade safely very profitably. Do not be jumpy in trading Orbit be patient – DO NOT FORGET THAT WHEN ORBIT FINDS THE TREND IT WILL BE FOR MANY, MANY PIPS ALL YOURS IN RISK FREE - SPACE. Do not think as you did before when you were trading risky space. Then you were blind, not knowing were the market is going is torture yes, but that is no excuse to make a mistake in Orbit -----> the Pips are ahead and in risk-free space.
So you see patience has a calculated meaning in Chaos. YOU WAIT when not sure. Because you must accept that Intermittency is a property of dynamical systems and it causes indicators to flip back and forth so it is not a matter of gaining some lookback that will NEVER flicker it is a matter of knowing the fluctuant type and the topologies in which it occurs and by calculation, timing it for shape. Then using information for that shape to calculate the amount of distortion required in that space and therefore time the various actions. Not simple but that is what we did for the more robust Cloud Version. The algorithm there will completely hang MT4 and there are many, many more like it. So not possible in the current prototype. Please see the trade book.
(-_-)
For the prototype what did I do? See my trade below but do not use my entry (as you can see no signal was changed to you, but to me the signal was the pivot), but does it mean it is all over and I can go to sleep? No this is like piloting a take off and we watch the pattern of pivoting and read the weights. Because as a matter of fact page 12 says that we need a lower low + lower high to confirm Phaselock + Risk-Free space as you can see on the simple drawing which is in fact a serious calculation. So looking at the KSO we were at amplitude by the spike on which I entered and therefore at a limiting extreme and as such we MUST fall. So as you see @ImpLaNT I chose my combination of signals to be what tells me an extreme to enter because I depend on the logic not the signals. The logic says Price = Extreme = Inverse On. And I know the logic and therefore, I am better than any indicator because of that. However, learning is step by step so keep with the indicators if you are new to chaos. When you master you can vary. It is a science it can be learned step by step because deterministic trading is not random. Random systems can NEVER EVER be mastered. You wanted to know and for me to show you how I enter trades (you said it was more important to you than any mathematical concept that I render). That is one example but it all depends where we are in space so I can vary the logic by topology of course our nested or inductive signalling structure is excellent and should be used by new comers to Mandelbrotian randomness. Once risk-free space is confirmed I trade the normal signal (nested) structure because does not take my blood pressure up like this (yes I still do not believe and lack the confidence to see I am trading the Grail. But I trade well by it anyway and it works). The moral is that it is logic that gives you an edge even within an implementation that is correct 100/100 times so you make more money than less expert traders. Because we do not trade random space your income from trading should mirror more closely your trading skills. By the way in this case as you can see from the last screenshot I am over 1000 points in Good money (almost the same as Orbit 1542 points, so I reset my stop to breakeven 1902 price turned at 1904.52. My economics is good very good and done coolly too. I am trading to make money by growing an account and so I find the certainty of chaos the best environment to do so and you can see nothing here really depends on confluence because nothing in this complex mathematical space justifies confluence and it would be a waste of time making a special provision for it because you would introduce errors into the space that way and at exponential rates of change errors multiply at exponential speeds – do not forget the equation of markets describe a parabola and price behaves as such.
- Rating: 0.6%