Re: GBP news
2Sterling covered a third of the losing positions against the dollar after the selloffs urged by fear around elections in UK and most likely next week may continue to recover.
Re: GBP news
3GBP explodes after after Barnier says the EU wants to make a Brexit deal 

Re: GBP news
6Yep, good call mate. It's finally retracing now. Took profit on my GBP short trades so now looking at buying just under the Fibs 50 retracement level on GBPCAD.
Re: GBP news
7I am thinking whether I should short on GBP/USD now or wait until it breaks out below 1.2800.
Re: GBP news
9GBP/USD extends slide after EU summit to fresh weekly lows
Pound losses strength after EU summit and prints new daily lows across the board.
Cable hits lowest since October 9, near 1.3050.
The GBP/USD pair dropped further during the last hours and extend losses. It reached 1.3057 and rebounded modestly. It was hovering under 1.3070, still under pressure.
The move to the downside took place amid a stronger US dollar and particularly on renewed weakness around the pound following the end of the European Union summit in Brussels. UK PM Theresa May explained that a longer transition period could help solve the Irish border issue. European Union officials consider that a longer transition will probably take place.
GBPUSD Weekly Technical Outlook: Higher Prices Unlikely
10GBPUSD Weekly Technical Outlook: Higher Prices Unlikely
GBPUSD TECHNICAL HIGHLIGHTS, PRICES AND ANALYSIS
- GBPUSD 1.3000 holds two attempts.
- Four lower highs are ominous.
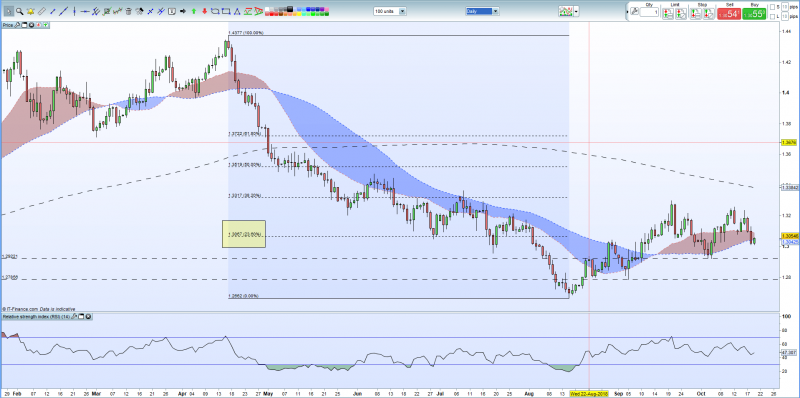
Short-Term GBPUSD Chart – Upside Potential Limited
This week’s break lower has taken GBPUSD below all three moving averages and paints a negative picture for the pair. Potential upside is guarded at 1.3086 (200-day) ahead of 1.3128 (20-day) and 1.31495 (50-day). The RSI indicator has turned higher just before falling into oversold territory and may indicate a short-term bounce to the 200-day level noted above. A break below 1.3000 would open the way to the recent low at 1.2922.
GBPUSD FOUR HOUR PRICE CHART OCTOBER 19, 2018
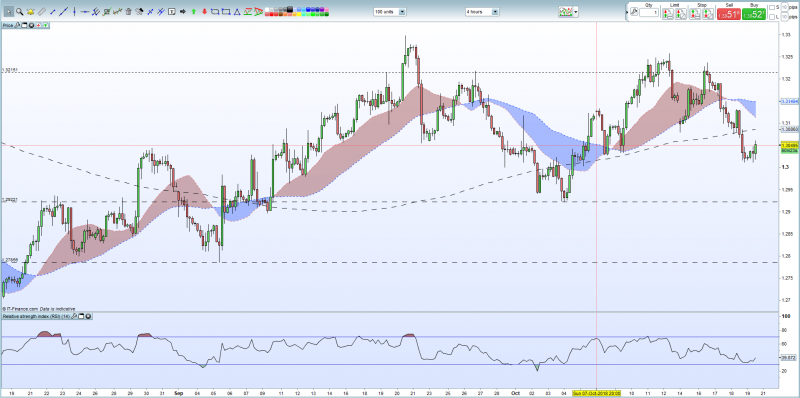
GBPUSD made two attempts at the end of the week to break through 1.30000 but failed both on both occasions. The chart also shows the last four candles with lower highs, a negative, while Fibonacci retracement at 1.3067 may offer a limited resistance. If 1.3000 is broken, support at 1.2922 should prove robust in the short-term, ahead of 1.27856. Bullish momentum will find resistance at 1.3258 ahead of 1.32986, with the latter unlikely to be broken until the fundamental backdrop changes.
GBPUSD Daily Price Chart October 19, 2018
Source: https://www.dailyfx.com/forex/technical ... ikely.html
GBPUSD TECHNICAL HIGHLIGHTS, PRICES AND ANALYSIS
- GBPUSD 1.3000 holds two attempts.
- Four lower highs are ominous.
Short-Term GBPUSD Chart – Upside Potential Limited
This week’s break lower has taken GBPUSD below all three moving averages and paints a negative picture for the pair. Potential upside is guarded at 1.3086 (200-day) ahead of 1.3128 (20-day) and 1.31495 (50-day). The RSI indicator has turned higher just before falling into oversold territory and may indicate a short-term bounce to the 200-day level noted above. A break below 1.3000 would open the way to the recent low at 1.2922.
GBPUSD FOUR HOUR PRICE CHART OCTOBER 19, 2018
GBPUSD made two attempts at the end of the week to break through 1.30000 but failed both on both occasions. The chart also shows the last four candles with lower highs, a negative, while Fibonacci retracement at 1.3067 may offer a limited resistance. If 1.3000 is broken, support at 1.2922 should prove robust in the short-term, ahead of 1.27856. Bullish momentum will find resistance at 1.3258 ahead of 1.32986, with the latter unlikely to be broken until the fundamental backdrop changes.
GBPUSD Daily Price Chart October 19, 2018
Source: https://www.dailyfx.com/forex/technical ... ikely.html


