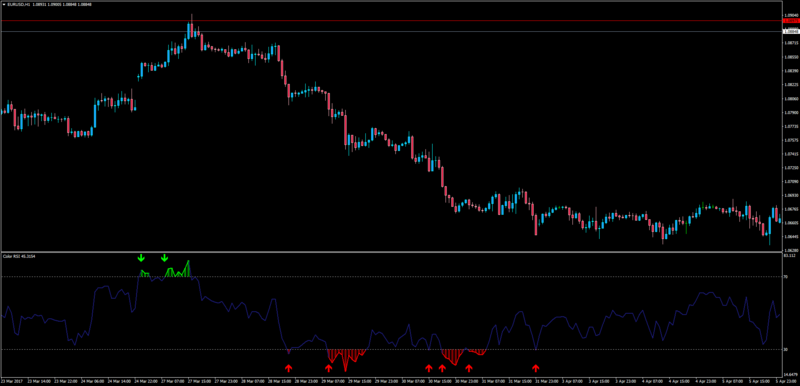
Brooky RSI Ichimoku indicator for MT4
Place Ichi in sub window!
It is based on the standard MT4 Ichimoku Kinko Hyo indicator but it is designed to track the RSI values instead in a sub window.
You can use it as confirmation of other strategies, or if you are a dedicated Ichi user you can use it as a fantastic adjunct to your Ichi charts
Automatic shading system that matches the color of your chart automatically.
Dll's need to be allowed for this version.
This saves you the trouble of matching the last color to that of your chart
so that the clouds appear to float. Once loaded the auto color needs 1 tick to find your charts color.
AussieBeau
 Re: Something interesting please post here (Metatrader)
722
Brooky MACD Ichimoku indicator for MT4
The MACD is one of the stable indicators around which many strategies have been developed.
In an attempt to apply some market sentiment indications to it ,Ichimoku concepts has been added to it's values.
You can use it as confirmation of other strategies, or if you are a dedicated Ichi user you can use it as a fantastic adjunct to your Ichi charts
Automatic shading system that matches the color of your chart automatically.
Dll's need to be allowed for this version.
This saves you the trouble of matching the last color to that of your chart
so that the clouds appear to float. Once loaded the auto color needs 1 tick to find your charts color.
AussieBeau
Re: Something interesting please post here (Metatrader)
723
Brooky Adx Ichimoku indicator for MT4
The ADX is one of the stable indicators around which many strategies have been developed.
In an attempt to apply some market sentiment indications to it ,Ichimoku concepts has been added to it's values.
You can use it as confirmation of other strategies, or if you are a dedicated Ichi user you can use it as a fantastic adjunct to your Ichi charts
Automatic shading system that matches the color of your chart automatically.
Dll's need to be allowed for this version.
This saves you the trouble of matching the last color to that of your chart
so that the clouds appear to float. Once loaded the auto color needs 1 tick to find your charts color.
AussieBeau
Re: Something interesting please post here (Metatrader)
724Good daybilbao wrote:Wed Jun 07, 2017 7:10 am work like market profile
but on each bar calculate volume
note:for first time loading, eat CPU
this indicator freezes the charts,is there a way to fix it?
 Re: Something interesting please post here (Metatrader)
725
RSI panel display
If you trade with RSI indicator, here is another way to use it. This indicator will draw a small panel that shows all RSI values on all timeframes and will alert you when the price enters the Oversold, Overbought zones.
Features:
AussieBeau
If you trade with RSI indicator, here is another way to use it. This indicator will draw a small panel that shows all RSI values on all timeframes and will alert you when the price enters the Oversold, Overbought zones.
Features:
- Change panel style
- Change panel direction
- Choose corner placement
- Can be placed in Sub Window
- Change RSI settings
- Alert, Email, Notification, Sound
AussieBeau
Attachments
Re: Something interesting please post here (Metatrader)
726Market Profile display of volumesunnym wrote: Sat Jul 01, 2017 4:53 pm
Good day
this indicator freezes the charts,is there a way to fix it?
It does not freeze the charts
It is just heavy on the CPU - you have to wait to get something like this
in any case one change in the code (so that it can be compiled)
Re: Something interesting please post here (Metatrader)
727RSI that displays color filled areas on overbought or oversold
Attachments
Re: Something interesting please post here (Metatrader)
728
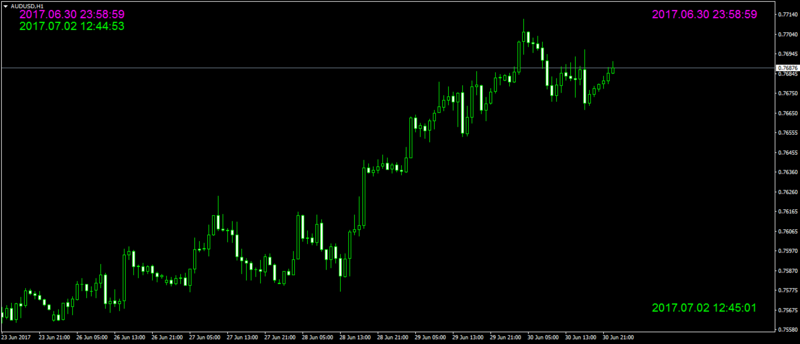
Display Broker and local time indicator On Chart
Place Broker Time, Local Time or both on your chart anywhere any window.
I modified this indicator for my own needs , but I think it may be handy for others.
AussieBeau
Local:
Broker:
Both:
Place Broker Time, Local Time or both on your chart anywhere any window.
I modified this indicator for my own needs , but I think it may be handy for others.
//Modified by AussieBeau 2nd July 2017AussieBeau
Local:
Broker:
Both:
- These users thanked the author AussieBeau for the post:
- GelindoP
 Re: Something interesting please post here (Metatrader)
729
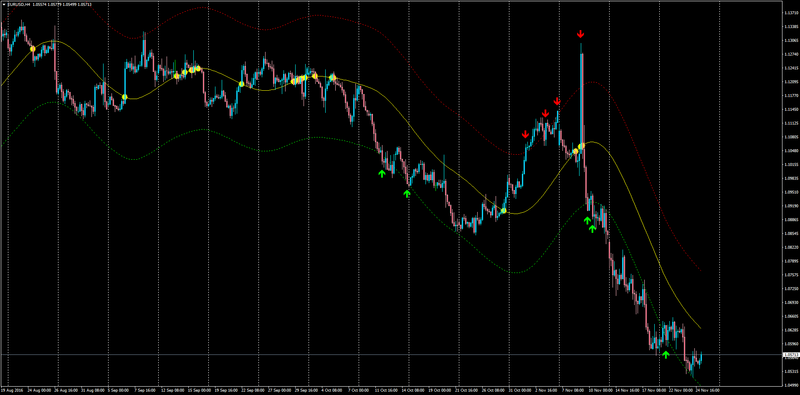
Highly Adaptable Moving Average
This indicator displays the channel built using any of the seventeen moving averages.
When the price crosses the extreme and central channel lines, a signal pointer is set and an event message is sent.
The indicator has eight adjustable parameters:
This indicator displays the channel built using any of the seventeen moving averages.
When the price crosses the extreme and central channel lines, a signal pointer is set and an event message is sent.
The indicator has eight adjustable parameters:
- Simple
- Exponential
- Smoothed
- Linear-Weighted
- Wilder Exponential
- Sine-Weighted
- Triangular
- Least Square
- Hull MA by Alan Hull
- Zero-Lag Exponential
- Instantaneous Trendline by J.Ehlers
- Moving Median
- Geometric Mean
- Regularized EMA by Chris Satchwell
- Integral of Linear Regression Slope
- Combination of LSMA and ILRS
- Triangular MA generalized by J.Ehlers
- These users thanked the author tampa for the post (total 2):
- RodrigoRT7, GelindoP
Re: Something interesting please post here (Metatrader)
730Display RSI Values on Chart (or subwindow) & Display Stochastic Values on Chart (or subwindow)
These useful indicators will display:
Multi Instances..just change the multi number
Color Changes depending on values
Just a couple of handy little indicators
AussieBeau
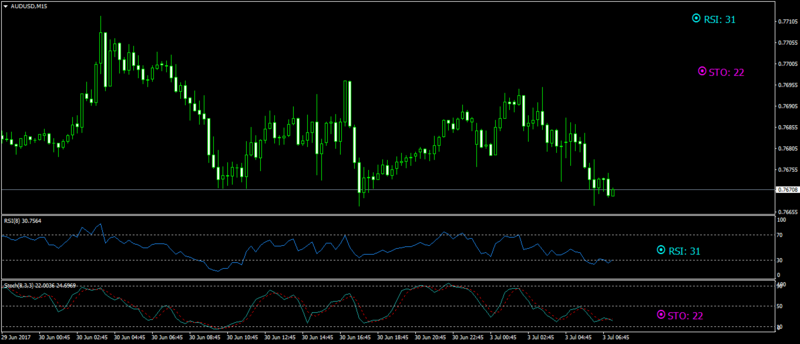
These useful indicators will display:
- RSI Values on Chart or subwindow
- Stochastic Values on Chart or subwindow
Multi Instances..just change the multi number
Color Changes depending on values
Just a couple of handy little indicators
AussieBeau

