Re: Bollinger Bands Indicators for MT5

11
Banzai wrote: Fri Apr 29, 2022 4:42 am Moving Average Bands - extended (on/off button)
Image


Moving Average Bands - extended BT.mq5 indicator Candles is good.

To beautify the look:
Expect the teacher to change the Candles core thickness to 2 and the Candles body thickness to 4.

Infinite merit!
These users thanked the author 太虚一毫 for the post (total 2):
alexm, Abdi


Re: Bollinger Bands Indicators for MT5

12
Banzai wrote: Fri Apr 29, 2022 4:42 am Moving Average Bands - extended (on/off button)
Image


If the price crosses the middle line, it's considered as a flat, and the Bands filled with grey color.
Image
ibbfill2.mq5
[/quote]

Looking forward to adding a button to ibbfill2.mq5 when the teacher has free time. :thumbup:

Infinite merit!
These users thanked the author 太虚一毫 for the post:
DaffyTaffy

Re: Bollinger Bands Indicators for MT5

13
As described by John Ehlers :

This pass-band oscillator seeks to pass-band out both high and low frequencies from market data to eliminate wiggles from the resultant signal thus significantly reducing lag. This pass-band indicator achieves this by using 2 differenced EMA's of varying periods. (40 and 60). Trigger points for the pass-band oscillator are added with a RMS cyclic envelope over the Signal line. Output of the pass-band waveform is calculated by summing its square over the last 50 bars and taking the square root of the averaged sum to create trigger levels.

Buy when pass-band crosses above its -RMS line. Short when pass-band crosses below the RMS line.

Deviation from the original is that different calculating periods are allowed (defaults are as he described, but any calculating periods are allowed)

This indicator also has somewhat unusually big choice of prices - 22 types - you shall find their descriptive names in the drop down choice box for prices (they are self descriptive so there should not be a problem in recognizing what do they stand for)

Indicator is already having all the usual set of alerts and is multi time frame. Addition of filled areas when the RMS envelope is exited is added in order to help pinpoint (along with alerts) the moment when the break happens. Some parameters experimenting is advised though - John Ehlers usually tests his idea on commodities - where the volatility is significantly lower than in forex - and some adjustments to forex conditions are probably a sensible choice
Image
These users thanked the author Jedidiah for the post:
Chickenspicy
Be patient therefore, brethren, until the coming of the Lord. Behold, the husbandman waiteth for the precious fruit of the earth: patiently bearing till he receive the early and latter rain.
Behold, we account them blessed who have endured. You have heard of the patience of Job, and you have seen the end of the Lord, that the Lord is merciful and compassionate.

Re: Bollinger Bands Indicators for MT5

14
As simple as it gets, channels based om high, low and ATR distances, Shows possible short term support / resistance or can be used as tp/sl in some trading systems
Image
Image
Recommendations:

in this form it is not meant to be used signals
instead it should be used for trends, support, resistance estimation, or, as told above, for TP or SL settings
Image
Image
This is the indicator originally posted here Limit channels that is extended with a display of "states".

"states" are displayed as colored histogram
they can be calculated using :
level 3 - outer levels - the "slowest"
level 2 - middle levels
level 1 - the inner levels - the "fastest"

Recommendations:
This is just a suggestion how the levels of this kind can be used
A lot more combinations from 6 levels can be added but that is left to the discretion of anybody using the levels indicator
You can use color changes as possible "signals"
These users thanked the author Jedidiah for the post:
alexm
Be patient therefore, brethren, until the coming of the Lord. Behold, the husbandman waiteth for the precious fruit of the earth: patiently bearing till he receive the early and latter rain.
Behold, we account them blessed who have endured. You have heard of the patience of Job, and you have seen the end of the Lord, that the Lord is merciful and compassionate.

Re: Bollinger Bands Indicators for MT5

15
From Mladen Rakic:

Williams %R, WPR, or just %R, is a technical analysis oscillator showing the current closing price in relation to the high and low of the past N days (for a given N). It was developed by a publisher and promoter of trading materials, Larry Williams. Its purpose is to tell whether a stock or commodity market is trading near the high or the low, or somewhere in between, of its recent trading range.

The oscillator is on a negative scale, from −100 (lowest) up to 0 (highest), obverse of the more common 0 to 100 scale found in many Technical Analysis oscillators. A value of −100 means the close today was the lowest low of the past N days, and 0 means today's close was the highest high of the past N days. (Although sometimes the %R is adjusted by adding 100.)

This version of Williams Percent Range has an addition of Bollinger bands to help identify possible overbought and oversold levels breaks.
These users thanked the author mrtools for the post (total 5):
Jedidiah, thiru, alexm, Chickenspicy, ionone


Re: Bollinger Bands Indicators for MT5

16
From Mladen Rakic:

Well known BB Stops (Bollinger Bands Stops) indicator with some additions and further adapting to MetaTrader 5 usage.

In this version you can chose the average type that should be used for calculation, deviation sample correction, and the usual things (like usual set of alerts and multi time frame options).

BB stops mostly can be used two ways:

*as "trending" indicator;
*as indicator to be used for stop loss targets.
In either case, the "direction" of the current market estimation is displayed, and the target value (when the "direction" will be changed) is displayed in this version — to help in decision making.

The usual "big picture" view too last snapshot

Parameters are adjusted for the common usage. Some parameters experimenting is advised in any case (to be able to adjust the indicator to trading styles, symbols or time frames and trading risks).
These users thanked the author mrtools for the post (total 2):
Jedidiah, Chickenspicy

Re: Bollinger Bands Indicators for MT5

17
Weighted Deviation from Mladen Rakic:

This weighted deviation is a sort of all linear weighted deviation. It uses linear weighting in all the steps calculated (which makes it different from the built in deviation in a case when linear weighted ma is used in the ma method). It is more responsive than the standard deviation


Recommendations:

* Use it as any deviation indicator
These users thanked the author mrtools for the post:
Jedidiah

Re: Bollinger Bands Indicators for MT5

20
Bollinger Squeeze Basic

coder: EarnForex
date: 2022

Bollinger Squeeze Basic MetaTrader indicator — is a complex indicator based on Momentum, Bollinger bands, and Keltner channel. The indicator is drawn in the separate window of the chart as a Momentum histogram and a range of dots when show the relationship between the current Bollinger bands and Keltner channel values.
Input parameters
MaxBars (default = 300) — the maximum number of bars on the chart to apply the indicator to.
BB_Period (default = 20) — the period for the Bollinger bands indicator.
BB_Deviation (default = 2.0) — the Bollinger bands deviation parameter.
Keltner_Period (default = 20) — the period for the Keltner channel indicator.
Keltner_Factor (default = 1.5) — the Keltner channel multiplication factor.
Momentum_Period (default = 12) — the period for the Momentum indicator.
EnableNativeAlerts (default = false) — if true, MetaTrader's native pop-up alerts will be used on the BB/Keltner arrows' change of color.
EnableEmailAlerts (default = false) — if true, MetaTrader's email alerts will be sent on the BB/Keltner arrows' change of color. Email should be properly configured in MetaTrader via Tools->Options->Email.
EnablePushAlerts (default = false) — if true, MetaTrader's push notification alerts will be sent to your device upon the BB/Keltner arrows' change of color. Notifications should be properly configured in MetaTrader via Tools->Options->Notifications.
TriggerCandle (default = Previous) — the candle to issue alerts on: Previous — the most recently closed candle or Current — the yet unfinished candle.
Example and strategy

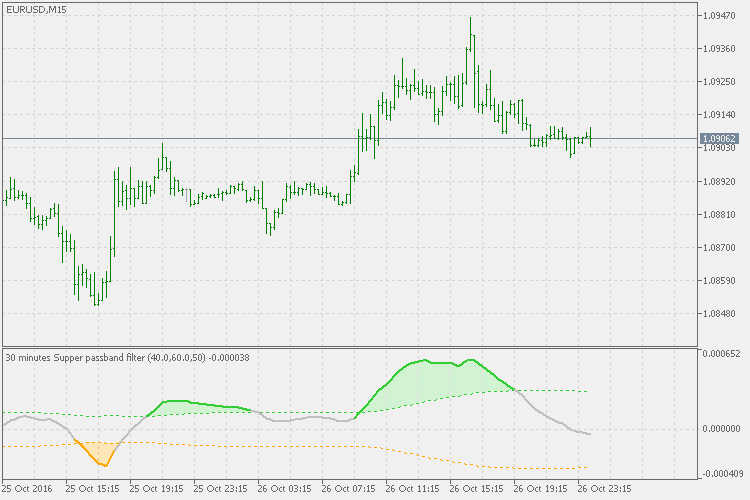
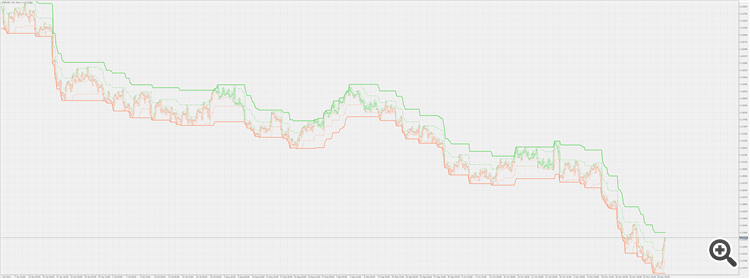
Bollinger Squeeze Basic Indicator Example MetaTrader Chart
The indicator uses the momentum to measure the trend's strength and direction:

Rising momentum above the zero line (uptrend) is marked with darker green bars.
Falling momentum above the zero line (also uptrend) is marked with lighter green bars.
Rising momentum below the zero line (downtrend) is marked with darker red bars.
Falling momentum below the zero line (also downtrend) is marked with lighter red bars.

Additionally, Bollinger Squeeze Basic offers an interesting volatility measure built into the main histogram.
The range of blue and red squares on the zero line indicate the current relationship between the Bollinger bands and the Keltner channel:

If the squares are red, the Bollinger bands are outside the Keltner channel, which suggests that exchange rate is trending strongly.
If the squares are blue, the Bollinger bands are inside the Keltner channel, which suggests a flat sideways market.

The main idea behind this indicator is to establish trading ranges
during the non-trending phase of the market (blue squares) to enter on a breakout and
a switch to red squares (trending phase).
The histogram will suggest how strong the current trend is and will tell you when to exit a trade on the trend's weakening.
These users thanked the author Banzai for the post (total 2):
vvFish, Mickey Abi


Who is online

Users browsing this forum: kvak and 5 guests