From Mladen:
In “ Moving Average Bands” (part 1, TASC July 2021 issue) and “Moving Average Band Width” (part 2, TASC August 2021 issue), author Vitali Apirine explains how moving average bands can be used as a trend-following indicator by displaying the movement of a shorter-term moving average in relation to the movement of a longer-term moving average
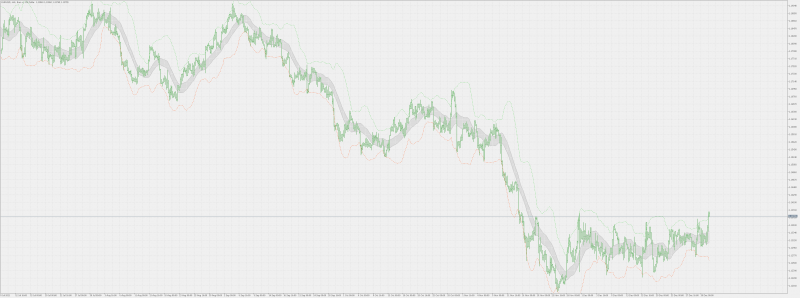
This is the "Moving Average Bands" indicator with only one change compared to the original : you can chose the price (while in the original only close price is used)
Recommendations:
You can use color changes for entries, re-entries and possible exits
This is the extended version.
Re: MT5 Band Indicators
2By Mladen and his description:
According to the author Vitali Apirine, the width of the moving average bands indicator can be used as an indicator of volatility.
Vitali Apirine:
The distance between the bands will widen as volatility increases and will narrow as volatility decreases. The moving average band width (MABW) measures the percentage difference between the bands. Changes in this difference may indicate a forthcoming move or change in the trend.
In this version the only deviation from the original published in TASC August 2021 magazine is that the indicator is drawing periods when the bands width is reaching its extreme lows in red (as a possible sign of expansion after extreme congestion)
Recommendations:
It is not a directional indicator - it indicates volatility
You can probably use it for indication of possible trend changes (after the lower extremes are reached) or trend continuation after a period of ranging
Shalom Shalom! 
Re: MT5 Band Indicators
4From Mladen Rakic:
In the Bollinger bands common usage people apply the (most commonly) used bands deviation 2 without being aware why that deviation is used.
Based on statistics, if we use deviation 2, then 95.4% of the PRICE must lie between the two bands. And that is true. But to have that, you should use line charts, not bar or candle charts - since with either of those you get a false impression that there is much more than those expected 4.6% of cases when the price breaks out of the bands
This version is made to address that and is keeping the bars/candles prices within the expected % of the normal distribution
 PS: compared to regular Bollinger bands, the difference can be significant
In the Bollinger bands common usage people apply the (most commonly) used bands deviation 2 without being aware why that deviation is used.
Based on statistics, if we use deviation 2, then 95.4% of the PRICE must lie between the two bands. And that is true. But to have that, you should use line charts, not bar or candle charts - since with either of those you get a false impression that there is much more than those expected 4.6% of cases when the price breaks out of the bands
This version is made to address that and is keeping the bars/candles prices within the expected % of the normal distribution
Shalom Shalom!
Re: MT5 Band Indicators
5This is a version of better Bollinger bands using Mladen's Bollinger band extended.
Shalom Shalom!
Re: MT5 Band Indicators
6Dear mrtoolmrtools wrote: Mon Jan 03, 2022 6:24 am From Mladen Rakic:
In the Bollinger bands common usage people apply the (most commonly) used bands deviation 2 without being aware why that deviation is used.
Based on statistics, if we use deviation 2, then 95.4% of the PRICE must lie between the two bands. And that is true. But to have that, you should use line charts, not bar or candle charts - since with either of those you get a false impression that there is much more than those expected 4.6% of cases when the price breaks out of the bands
This version is made to address that and is keeping the bars/candles prices within the expected % of the normal distribution
PS: compared to regular Bollinger bands, the difference can be significant
Mr. Bollinger, the developer of Bollinger Bands, created Bollinger Bands based on the misconception that stock prices and forex exchange rates are normally distributed.
However, since stock prices and forex exchange rates are not normally distributed but power-law distribution, the assumption is wrong to begin with.
In other words, the 1-sigma,2-sigma and 3-sigma lines of the Bollinger Bands are not 68.26%, not 95.44%, not 99.7% lines, and they do not mean anything mathematically.
This is well known and Mr.Bollinger admits his mistake.
Even though they are mathematically incorrect, it is also true that Bollinger Bands are popular as a trading tool.
Maybe it's better for discretionary traders to be able to visually see squeezes and expansions.
P.S. Please forgive my immature English writing.
Mrs.W
- These users thanked the author Mrs.Watanabe for the post:
- mrtools
At the back of a road in common use is another road in the mountain of flowers; you may take either way but be in time still in bloom.(Rikyu SEN)
人の行く裏に道あり花の山
いずれを行くも散らぬ間に行け (利休百首外から)
人の行く裏に道あり花の山
いずれを行くも散らぬ間に行け (利休百首外から)
Re: MT5 Band Indicators
7Thanks for your insightful comment! I have read somewhere about probability theory and sorta grasp what you're conveying. So as a solution to this, what are other indicators you think should be used instead?Mrs.Watanabe wrote: Tue Mar 22, 2022 7:40 am Dear mrtool
Mr. Bollinger, the developer of Bollinger Bands, created Bollinger Bands based on the misconception that stock prices and forex exchange rates are normally distributed.
However, since stock prices and forex exchange rates are not normally distributed but power-law distribution, the assumption is wrong to begin with.
In other words, the 1-sigma,2-sigma and 3-sigma lines of the Bollinger Bands are not 68.26%, not 95.44%, not 99.7% lines, and they do not mean anything mathematically.
This is well known and Mr.Bollinger admits his mistake.
Even though they are mathematically incorrect, it is also true that Bollinger Bands are popular as a trading tool.
Maybe it's better for discretionary traders to be able to visually see squeezes and expansions.
P.S. Please forgive my immature English writing.
Mrs.W
Re: MT5 Band Indicators
8viewtopic.php?p=1295464101#p1295464101TropicalSteve96 wrote: Sun Apr 10, 2022 4:34 am Thanks for your insightful comment! I have read somewhere about probability theory and sorta grasp what you're conveying. So as a solution to this, what are other indicators you think should be used instead?
Mrs.W
At the back of a road in common use is another road in the mountain of flowers; you may take either way but be in time still in bloom.(Rikyu SEN)
人の行く裏に道あり花の山
いずれを行くも散らぬ間に行け (利休百首外から)
人の行く裏に道あり花の山
いずれを行くも散らぬ間に行け (利休百首外から)
Re: MT5 Band Indicators
9XARD777's Goldbands
Released date: April 6, 2022
Coder: FXCodeBase dot com
-----------------------------------------------------------------------------
edit 4/25/22:
Please download a newer version at:
viewtopic.php?p=1295466202#p1295466202
Thank you.
Released date: April 6, 2022
Coder: FXCodeBase dot com
-----------------------------------------------------------------------------
edit 4/25/22:
Please download a newer version at:
viewtopic.php?p=1295466202#p1295466202
Thank you.
Re: MT5 Band Indicators
10This indicator is translated from tradingview indicator of same name. It has couple of options so user may need to read about the original version's.
- These users thanked the author Darks for the post (total 3):
- thomdel, RodrigoRT7, alexm


 Agent 5 — Voice & Dashboard It tells you: You d
 Agent 4 — Risk & Execution This is the one that