Lol you could have traded the green signals as a pullback within the trend. A similar way i trade it. You need to understand that Haos is build on WPR/Stoch. It is always bad to trade it as a reversal during a strong trend. Better trade within the trade while MACD is oversold/downtrend.
Re: Chaos Visual Averages Indicators for MT4
382Dear Mr mrtools.mrtools wrote:
Fixed it, still waiting on a signal for the alerts, but they should be ok.
This indicator is great. I want you to add MTF.
 Re: Chaos Visual Averages Indicators for MT4
383
Haos Visual Averages Histogram with Multi-timeframe mode & AlertsTOMO wrote: Wed Dec 08, 2021 12:10 am Dear Mr mrtools.
This indicator is great. I want you to add MTF.
Mtf added.
- These users thanked the author mrtools for the post (total 3):
- 太虚一毫, Jimmy, Krunal Gajjar
Shalom Shalom! 
 Re: Chaos Visual Averages Indicators for MT4
385
Haos Visual Source Code and Setup for counter-trend trading
Today we take a step back and revisit an original version of the modified WPR: Mr Slav's converted Haos Visual indicator but corrected and optimized by Mladen.
What is the Haos Visual?
The algorithm of the Haos Visual indicator measures the difference between two William’s Percent Range T3 oscillators with different periods.
A signal line is also calculated.
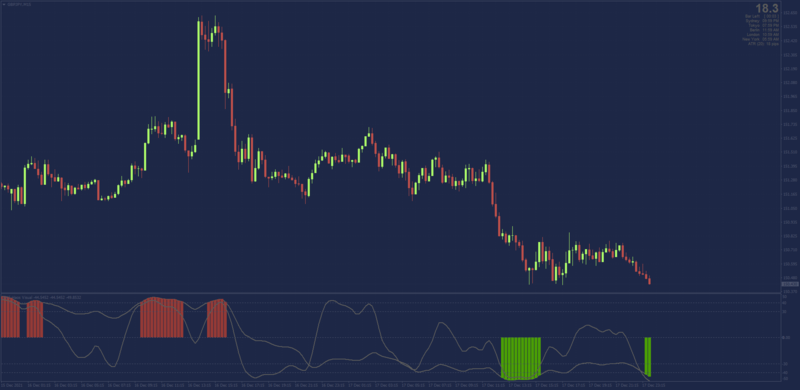
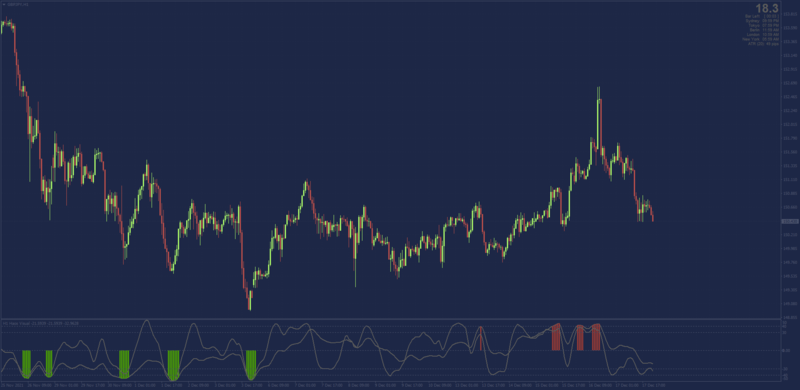
The Haos Visual stock market indicator identifies over-bought and over-sold markets and could be used to find potential price reversal key zones as well as displaying the sentiment of the market by using the "Zero" median line.
The following chart template:
The source code is available for coders to study and modify. Be sure to share your findings and modifications with us, too
Today we take a step back and revisit an original version of the modified WPR: Mr Slav's converted Haos Visual indicator but corrected and optimized by Mladen.
What is the Haos Visual?
The algorithm of the Haos Visual indicator measures the difference between two William’s Percent Range T3 oscillators with different periods.
A signal line is also calculated.
The Haos Visual stock market indicator identifies over-bought and over-sold markets and could be used to find potential price reversal key zones as well as displaying the sentiment of the market by using the "Zero" median line.
The following chart template:
- Has been setup using the indicator's default settings
- Highlights only the "extreme" reversal areas (for strong counter-trend opportunities)
The source code is available for coders to study and modify. Be sure to share your findings and modifications with us, too

Re: Chaos Visual Averages Indicators for MT4
386Thanks, nice X-mas present!
My interpretation:
- These users thanked the author josi for the post (total 4):
- BeatlemaniaSA, Jimmy, moey_dw, Thangarasu
Re: Chaos Visual Averages Indicators for MT4
387Beautiful chart, colors and setup. Thank you Josi
 Re: Chaos Visual Averages Indicators for MT4
388
merry xmas u josi......... love u haos chart dude!! real easy on the eyes too with grey/blue...........
Official Forex-station GIF animator at your service 
The best divergence indicator in the world.

The best divergence indicator in the world.
Re: Chaos Visual Averages Indicators for MT4
390Hmmh - it looks more like "simple" WPR than haos but probably I am missing something.
But I really like your main window indicator - do you mind sharing it (and its entries)?


