Yes, I've also conducted tracking tests on this. When the CCI reaches the 5-10/90-95 zone, if the market trend continues to develop, the CCI will vacate the 5-10/90-95 zone, allowing new CCI data generated from subsequent K-lines to occupy this zone. As long as there's no genuine trend reversal, this process will continue indefinitely.zelepuk wrote: Tue Sep 30, 2025 6:47 am Hello, firesword!
I noticed that if I move the historical charts, the CCI may move out of the 5-10/90-95 zone. Is this what you call the CCI movement along with the price? Is that how it should be? I understand that this is observed when there is a change in volatility. I'm attaching an example at the bottom, marked with a gray vertical line.
161
Re: Simple Trading System
162Yes, CCI is not the main player in this game. Watch the zones. If the price is going sideways inside the zone and then breaks the trend line,LIKE wrote: Tue Sep 30, 2025 11:53 am Yes, I've also conducted tracking tests on this. When the CCI reaches the 5-10/90-95 zone, if the market trend continues to develop, the CCI will vacate the 5-10/90-95 zone, allowing new CCI data generated from subsequent K-lines to occupy this zone. As long as there's no genuine trend reversal, this process will continue indefinitely.
then look at the CCI for confirmation, otherwise ignore CCI.
- Rating: 3%
Re: Simple Trading System
163Dear Cagliastro. I cant see your inticator STS Momentum in the bottom of thr chart. Any suggestion? Thanks in advance.Cagliostro wrote: Thu Sep 04, 2025 11:49 pm Thanks @firesword for this. Sometimes simple things are so nice.
For anyone using MT5 here you go with a template including:
-STS Zones that automatically draws updated last 2 weeks (fixed or rolling) high/low and the fibo levels
-STS Momentum that draws CCI over RSI and give signals when there is a possible break of trendlines (it uses multiple fractals) if you don't like it, draw it manually. Momentum also includes a gift, an optional TDR confirmation mechanism that draws arrows on the main chart when there is a volume breakout, it can be fine tuned, and includes an autosetting for the different instruments. Thick Density is one of the most advances and used volume methods used by institutional traders and banks.. so it should fit well here. Again, if you don't like it, don't use it
-True Trend > post1295568612.html#p1295568612
Let's see when Mr. Gold reverses.
image_2025-09-04_155041039.png
Re: Simple Trading System
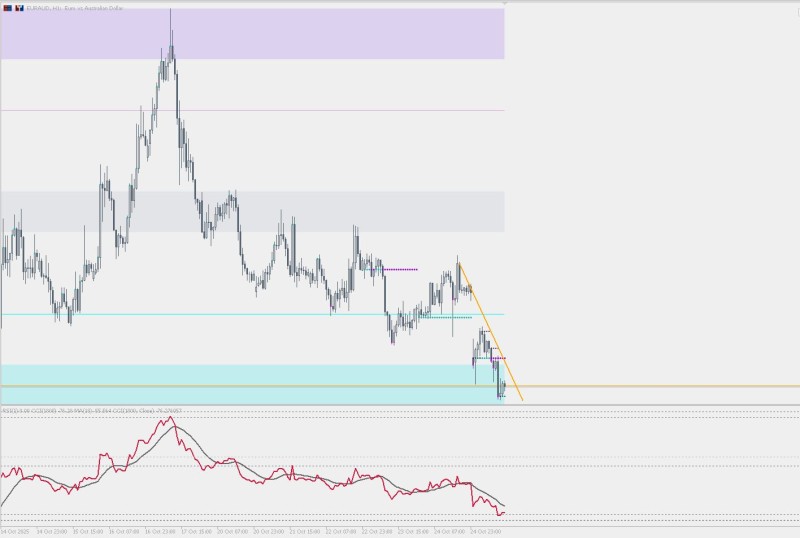
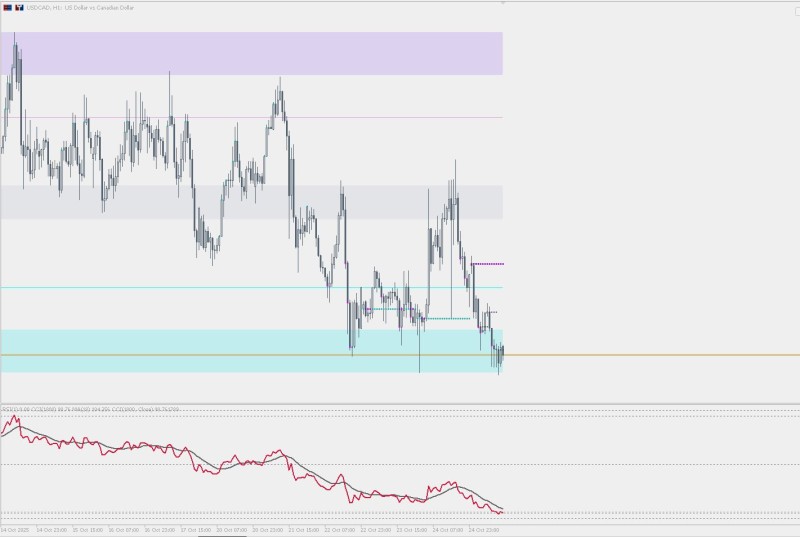
165This two look interesting today, no? 
- These users thanked the author Abdi for the post (total 2):
- macd & rsi, BeatlemaniaSA
- Rating: 1.2%
Re: Simple Trading System
166Yeah, I see EURAUD pushing up between 50 - 100 pips before a reversal.Abdi wrote: Mon Oct 27, 2025 10:42 pm This two look interesting today, no?
cci simple euraud.JPGcci simple usdcad.JPG
Potentially targeting the 6M open and/or the 50% fib
- These users thanked the author BeatlemaniaSA for the post:
- Abdi
- Rating: 0.6%
Millionaire Maker - “Amateurs chase. Professionals wait. Legends wait with a plan.”
BEATS V5 - "Enjoy The Quiet Between Trades”
Improve Your Trading Psychology - No fear, no doubt
Ultimate Risk Management - Maximize Your Trades
Supply and Demand Course - Learn Supply and Demand
BEATS V5 - "Enjoy The Quiet Between Trades”
Improve Your Trading Psychology - No fear, no doubt
Ultimate Risk Management - Maximize Your Trades
Supply and Demand Course - Learn Supply and Demand
Re: Simple Trading System
167EURAUD
- These users thanked the author firesword for the post (total 2):
- BeatlemaniaSA, Abdi
- Rating: 1.2%

Re: Simple Trading System
169Trying to get the same principles of Beatles' Millionare maker system.
- These users thanked the author Shelwin1 for the post:
- forexjoe85
- Rating: 0.6%
Re: Simple Trading System
170Nice one, good job my man.Shelwin1 wrote: Wed Oct 29, 2025 6:47 am Trying to get the same principles of Beatles' Millionare maker system.