Hello friends.
Long time ago (1999) I was using Market Analyst 2 platform for trading futures.
It had Gann swing charts on it.
It was disregarding unnecessary market noise from the charts, very similar to ZigZag but more precise.
I was just wondering if any of you coding magicians could create a Gan swing chart for MT4
that looks like the pic I attached below.
The original Gan swing chart doesn't have the bars showing but I'd be happy if you could create something like the attached pic.
I attached the pic with the rules for a swing chart.
Thank you.
God bless.
Re: Gann Swing Chart for MT4
2I have a lot of GANN stuff to investigate. No promises but have some spare time this weekendfiresword wrote: Sat Jul 11, 2026 8:49 pm Hello friends.
Long time ago (1999) I was using Market Analyst 2 platform for trading futures.
It had Gann swing charts on it.
It was disregarding unnecessary market noise from the charts, very similar to ZigZag but more precise.
I was just wondering if any of you coding magicians could create a Gan swing chart for MT4
that looks like the pic I attached below.
The original Gan swing chart doesn't have the bars showing but I'd be happy if you could create something like the attached pic.
I attached the pic with the rules for a swing chart.
Thank you.
God bless.

- These users thanked the author Cagliostro for the post:
- firesword
"I conjure from shadows and shape fortunes from the unseen. The treasure lies hidden in plain sight, beneath the sunlight." - Cagliostro
Re: Gann Swing Chart for MT4
3Thank you my friend.Cagliostro wrote: Sun Jul 12, 2026 5:41 am I have a lot of GANN stuff to investigate. No promises but have some spare time this weekend
I do appreciate your kindness and your time.
God bless.
As you get older 3 things happen. The first is your memory goes, and I can't remember the other two.
Re: Gann Swing Chart for MT4
4firesword wrote: Sun Jul 12, 2026 1:43 pm Thank you my friend.
I do appreciate your kindness and your time.
God bless.
Almost there. but there are still 2 major open questions, as it works only on forex (with different performances). It does not look bad
"I conjure from shadows and shape fortunes from the unseen. The treasure lies hidden in plain sight, beneath the sunlight." - Cagliostro
Re: Gann Swing Chart for MT4
5Cagliostro my good man.Cagliostro wrote: Sun Jul 12, 2026 5:31 pm image_2026-07-12_093114041.png
Almost there. but there are still 2 major open questions, as it works only on forex (with different performances). It does not look bad
That looks spot on.
Just the way I wanted it.
God bless you.
As you get older 3 things happen. The first is your memory goes, and I can't remember the other two.
Re: Gann Swing Chart for MT4
6Gann Swing Legacy v1.0 — deterministic Gann Swing Charts for MT4
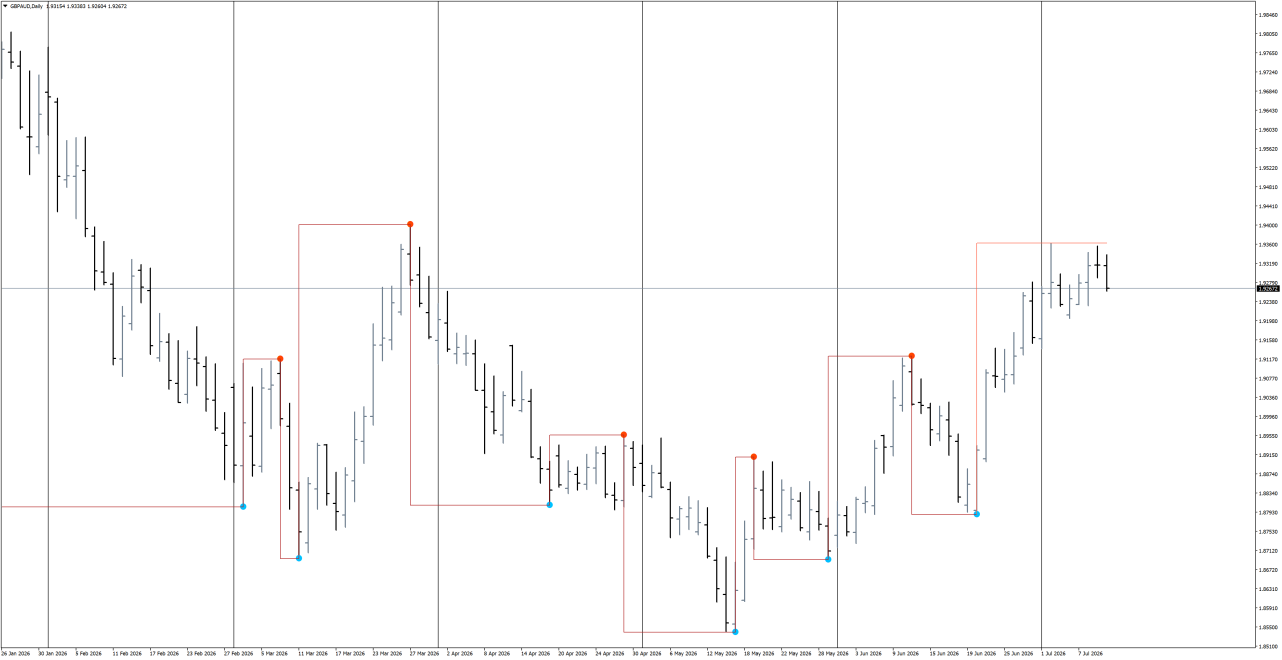
What it is
A boxed ("stair-step") Gann Swing Chart overlay for MT4, built the old way:
swings from highs and lows only, time and closing prices ignored, inside
bars skipped, outside bars held until the next bar decides them. Your price
bars stay visible; the red line draws the swing structure over them.
How faithful is this to Gann? The honest answer
Before writing a line of code we went to the primary sources: Gann's 1933
"Mechanical Method and Trend Indicator" and Master Courses, Robert Krausz's
1998 Stocks & Commodities article, and the Market Analyst/Optuma public
knowledge base for the modern lineage.
Straight from Gann's own texts:
From the Market Analyst / Optuma school (documented in their public
knowledge base — NOT found in Gann's texts):
Our modern engineering (not historical at all):
Does it repaint?
Confirmed pivots never move, never disappear, and a confirmed turn cannot
be un-confirmed — unlike the standard ZigZag, whose Depth/Deviation/
Backstep logic can relocate or delete a pivot retroactively. The only
living part is the current leg, which keeps extending until the opposite
bar closes. That is not repainting; that is the market not being finished
yet.
Under the hood
The engine was developed test-first against a Python reference model:
19 normative fixtures, buffer-level MT4/Python parity with zero mismatches
on BTCUSD M1 and GBPAUD D1, and deterministic rebuilds (same history in,
same pivots out, hash-verified). Eight documented buffers are exposed for
iCustom if you want to build EAs or studies on top of it.
Credits
Firesword for the request and the memory of the original; W.D. Gann's
Mechanical Method (1933, annotated 1955); Robert Krausz (Stocks &
Commodities, Feb 1998); the Optuma public knowledge base for the modern
documentation of this indicator family.
+C+
What it is
A boxed ("stair-step") Gann Swing Chart overlay for MT4, built the old way:
swings from highs and lows only, time and closing prices ignored, inside
bars skipped, outside bars held until the next bar decides them. Your price
bars stay visible; the red line draws the swing structure over them.
How faithful is this to Gann? The honest answer
Before writing a line of code we went to the primary sources: Gann's 1933
"Mechanical Method and Trend Indicator" and Master Courses, Robert Krausz's
1998 Stocks & Commodities article, and the Market Analyst/Optuma public
knowledge base for the modern lineage.
Straight from Gann's own texts:
- An up bar needs a higher high AND a higher low — "the first day that the
option records a higher bottom and a higher top". Krausz later dropped the
higher-low qualifier in his New Gann Swing Chartist; we kept Gann's
original requirement. - Construction uses highs and lows only — "not on closing prices".
- Inside ("within") days do not move the trend line.
- His main trend indicator counted 3 consecutive days — and in 1955 Gann
annotated his own course by hand: "Use 2 day charts and rules better than
3 day". Keep that in mind for the settings (Swing Count).
From the Market Analyst / Optuma school (documented in their public
knowledge base — NOT found in Gann's texts):
- The formal four bar types (higher / lower / inside / outside), each bar
measured against the immediately previous bar. - Outside bars resolved by the next decisive bar ("Use Next Bar"). Gann
read the tape and knew which extreme came first; on OHLC data we cannot,
so the school waits for the next bar to decide the order. - Consecutive outside bars: the last one becomes "the" outside bar (the
old pre-clustering Market Analyst rule). - The "two moves in one bar" resolution that draws a counter-swing into
the outside bar itself. We reconstructed this from the school's teaching:
it is plausible and it charts beautifully, but we label it RECONSTRUCTED,
not proven — and the indicator says so in its own log.
Our modern engineering (not historical at all):
- Exact price comparisons on integer ticks, zero tolerance, no hidden
noise filters. If you want fewer swings, raise the swing count — that is
the Gann way to filter: structure, not thresholds. - Equal highs/lows are treated as strictly neutral (they neither turn nor
extend a swing). - Signals only on closed bars. Confirmed pivots are frozen forever.
Does it repaint?
Confirmed pivots never move, never disappear, and a confirmed turn cannot
be un-confirmed — unlike the standard ZigZag, whose Depth/Deviation/
Backstep logic can relocate or delete a pivot retroactively. The only
living part is the current leg, which keeps extending until the opposite
bar closes. That is not repainting; that is the market not being finished
yet.
Under the hood
The engine was developed test-first against a Python reference model:
19 normative fixtures, buffer-level MT4/Python parity with zero mismatches
on BTCUSD M1 and GBPAUD D1, and deterministic rebuilds (same history in,
same pivots out, hash-verified). Eight documented buffers are exposed for
iCustom if you want to build EAs or studies on top of it.
Credits
Firesword for the request and the memory of the original; W.D. Gann's
Mechanical Method (1933, annotated 1955); Robert Krausz (Stocks &
Commodities, Feb 1998); the Optuma public knowledge base for the modern
documentation of this indicator family.
+C+
- These users thanked the author Cagliostro for the post (total 14):
- Akela, kudrpenk, PTR777, mazibee, emanuelmb10, ricosuaveiii, firesword, elvenso, Topguy7, JimKuba, Nik123, Knight, Tsar, EverGreen
"I conjure from shadows and shape fortunes from the unseen. The treasure lies hidden in plain sight, beneath the sunlight." - Cagliostro
Re: Gann Swing Chart for MT4
7=====================================================================
GANN SWING CHART PRO for MT4 (GannSwingChartPro_v1.0)
=====================================================================
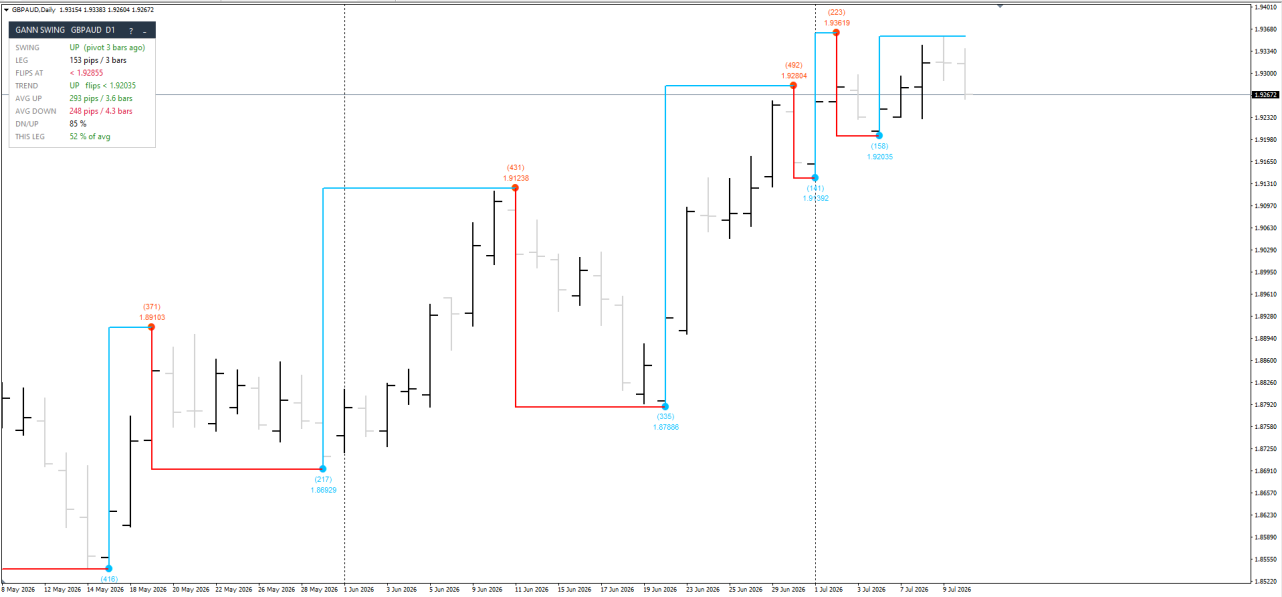
A classic W.D. Gann swing chart overlay with a live dashboard, higher-timeframe overlay and swing statistics.
My version using AI
 ---------------------------------------------------------------------
1. THE SWING RULES (what the indicator actually does)
---------------------------------------------------------------------
Classic 1-bar Gann swing chart:
- HIGHER BAR (higher high AND higher low) -> swing turns/stays UP
- LOWER BAR (lower high AND lower low) -> swing turns/stays DOWN
- INSIDE BAR (inside the previous range) -> ignored
- OUTSIDE BAR (engulfs the previous range) -> undecided, the indicator WAITS for the next directional bar to resolve it
Extras built in:
- EqualPips tolerance: a bar whose high/low misses the previous bar's level by only a couple of pips is treated as EQUAL, not as a reversal. This filters one-tick fake turns.
- Only CLOSED bars are used. The forming bar never flips the swing, so confirmed pivots do not repaint. Only the current developing leg extends as new bars close.
What is drawn:
- Stepped swing line : vertical + horizontal segments (up-legs and down-legs can have different colors)
- Orange dots : confirmed swing HIGHS
- Blue dots : confirmed swing LOWS
- Optional labels : pivot price, with the swing size in brackets, e.g. (223) 1.93619
- Gold/gray steps : the SAME swing logic computed on the next higher timeframe, drawn behind the chart
- Optional arrows : Gann TREND signals (see section 4)
---------------------------------------------------------------------
2. THE DASHBOARD
---------------------------------------------------------------------
Header buttons:
? opens a help panel beside the dashboard explaining every row [-] minimizes the dashboard to its title bar (+ restores it)
Hovering any row also shows its explanation as a tooltip.
Rows:
SWING: Current swing direction and how many CLOSED bars ago its pivot extreme formed.
LEG: Size of the developing leg from the last confirmed pivot to the running extreme (distance / bars).
FLIPS AT: The price that starts confirming the next swing turn: the reference bar's low (uptrend) or high (downtrend) +/- the EqualPips tolerance.
NOTE: this level RATCHETS with every new bar - treat it as a trailing trigger, valid until the next bar closes.
TREND: The QUALIFIED Gann trend. The trend only turns UP when price takes out the previous confirmed swing HIGH, and only turns DOWN when it breaks the previous confirmed swing LOW. The shown level flips it - unlike FLIPS AT, this level is FIXED until a new pivot confirms. This is the strongest number on the panel.
W1 SWING (or D1/H4... depending on chart) The higher-timeframe swing direction. ALIGNED = your chart swing agrees with it - the classic Gann filter is to trade only in that direction. COUNTER = you are against the higher TF.
AVG UP Average up-leg / down-leg size and duration over the AVG DOWN last N completed swings (default 20).
DN/UP Correction vs impulse ratio: average down-leg as a % of the average up-leg. Below 100% in an uptrend = healthy (corrections smaller than impulses). Above 100% = choppy, rallies are being fully retraced.
THIS LEG The current leg as a % of its same-direction average.
Green below 80% = leg is young, room to run
Black 80 - 120% = normal territory
Red above 120% = stretched, rotation risk (Gann's swing-exhaustion read)
Units: forex pairs show pips. Gold, indices and crypto automatically show price points instead (e.g. 1811 pts on DE40, 121.13 pts = $121 on ETHUSD). See UnitSize/UnitSuffix inputs to override.
---------------------------------------------------------------------
3. A SIMPLE GANN WORKFLOW
---------------------------------------------------------------------
1. Check W1 SWING on the dashboard. Trade only ALIGNED, or at least size down when COUNTER.
2. Wait for the chart swing to rotate into the higher-TF direction (blue up-leg forming after a swing low).
3. Enter on the TREND qualification: the arrow / the moment price takes out the previous swing high (trend up) or low (trend down).
Enable ShowTrendSignals to see these as arrows.
4. Initial stop: beyond the pivot that started the leg. Trailing idea: the FLIPS AT level follows the swing bar by bar.
5. Use THIS LEG %: entering when the leg is already 120%+ of average is chasing; look for the next rotation instead.
---------------------------------------------------------------------
4. MAIN INPUTS
---------------------------------------------------------------------
MaxBars History depth (0 = all bars)
SwingBars Consecutive bars needed to turn the swing (1 = classic; 2-3 = slower "main trend" charts)
OutsideMode WAIT (classic) or resolve outside bars by close
EqualPips Equal high/low tolerance in pips (default 3; set 0 for strict textbook rules)
UseCurrentBar Let the forming bar flip the swing (off = classic non-repainting behaviour, recommended)
UnitSize/Suffix Override distance units, e.g. UnitSize 0.1 + Suffix "pips" if you count gold in 0.10 pips
Up/DnLineColor Leg colors (set both the same for the classic single-color look)
ShowLabels Pivot price labels; LabelPips adds the swing size in brackets
ShowTrendSignals Arrows when price breaks the prior pivot HTFEnable/Period Higher-timeframe overlay; AUTO = next higher TF
ShowPanel/corner The dashboard and where it sits
StatsSwings How many completed swings feed the statistics
AlertPopup/Push Alert when a swing turn confirms (on bar close)
---------------------------------------------------------------------
5. GOOD TO KNOW
---------------------------------------------------------------------
- Confirmed pivots do not repaint. The developing leg (and its HTF equivalent) naturally extends until a turn confirms - that is how every swing chart works.
- Different brokers cut daily bars at different GMT offsets, so pivots can differ slightly between brokers on the same pair. That is the data, not the indicator.
- The dashboard state (minimized / help) resets when the indicator reloads or the timeframe changes.
- Works on any symbol and timeframe. On MN1 charts there is no higher timeframe, so the overlay row shows "n/a".
Happy trading,
Thanks to Firesword and Cagliostro.
Update:
I have learned so much from the free resources and the source available here so I am sharing the source as I believe that sharing is caring.
I hope seniors/ more experienced coders can enhance it further and share for the benefit of community.
GANN SWING CHART PRO for MT4 (GannSwingChartPro_v1.0)
=====================================================================
A classic W.D. Gann swing chart overlay with a live dashboard, higher-timeframe overlay and swing statistics.
My version using AI
1. THE SWING RULES (what the indicator actually does)
---------------------------------------------------------------------
Classic 1-bar Gann swing chart:
- HIGHER BAR (higher high AND higher low) -> swing turns/stays UP
- LOWER BAR (lower high AND lower low) -> swing turns/stays DOWN
- INSIDE BAR (inside the previous range) -> ignored
- OUTSIDE BAR (engulfs the previous range) -> undecided, the indicator WAITS for the next directional bar to resolve it
Extras built in:
- EqualPips tolerance: a bar whose high/low misses the previous bar's level by only a couple of pips is treated as EQUAL, not as a reversal. This filters one-tick fake turns.
- Only CLOSED bars are used. The forming bar never flips the swing, so confirmed pivots do not repaint. Only the current developing leg extends as new bars close.
What is drawn:
- Stepped swing line : vertical + horizontal segments (up-legs and down-legs can have different colors)
- Orange dots : confirmed swing HIGHS
- Blue dots : confirmed swing LOWS
- Optional labels : pivot price, with the swing size in brackets, e.g. (223) 1.93619
- Gold/gray steps : the SAME swing logic computed on the next higher timeframe, drawn behind the chart
- Optional arrows : Gann TREND signals (see section 4)
---------------------------------------------------------------------
2. THE DASHBOARD
---------------------------------------------------------------------
Header buttons:
? opens a help panel beside the dashboard explaining every row [-] minimizes the dashboard to its title bar (+ restores it)
Hovering any row also shows its explanation as a tooltip.
Rows:
SWING: Current swing direction and how many CLOSED bars ago its pivot extreme formed.
LEG: Size of the developing leg from the last confirmed pivot to the running extreme (distance / bars).
FLIPS AT: The price that starts confirming the next swing turn: the reference bar's low (uptrend) or high (downtrend) +/- the EqualPips tolerance.
NOTE: this level RATCHETS with every new bar - treat it as a trailing trigger, valid until the next bar closes.
TREND: The QUALIFIED Gann trend. The trend only turns UP when price takes out the previous confirmed swing HIGH, and only turns DOWN when it breaks the previous confirmed swing LOW. The shown level flips it - unlike FLIPS AT, this level is FIXED until a new pivot confirms. This is the strongest number on the panel.
W1 SWING (or D1/H4... depending on chart) The higher-timeframe swing direction. ALIGNED = your chart swing agrees with it - the classic Gann filter is to trade only in that direction. COUNTER = you are against the higher TF.
AVG UP Average up-leg / down-leg size and duration over the AVG DOWN last N completed swings (default 20).
DN/UP Correction vs impulse ratio: average down-leg as a % of the average up-leg. Below 100% in an uptrend = healthy (corrections smaller than impulses). Above 100% = choppy, rallies are being fully retraced.
THIS LEG The current leg as a % of its same-direction average.
Green below 80% = leg is young, room to run
Black 80 - 120% = normal territory
Red above 120% = stretched, rotation risk (Gann's swing-exhaustion read)
Units: forex pairs show pips. Gold, indices and crypto automatically show price points instead (e.g. 1811 pts on DE40, 121.13 pts = $121 on ETHUSD). See UnitSize/UnitSuffix inputs to override.
---------------------------------------------------------------------
3. A SIMPLE GANN WORKFLOW
---------------------------------------------------------------------
1. Check W1 SWING on the dashboard. Trade only ALIGNED, or at least size down when COUNTER.
2. Wait for the chart swing to rotate into the higher-TF direction (blue up-leg forming after a swing low).
3. Enter on the TREND qualification: the arrow / the moment price takes out the previous swing high (trend up) or low (trend down).
Enable ShowTrendSignals to see these as arrows.
4. Initial stop: beyond the pivot that started the leg. Trailing idea: the FLIPS AT level follows the swing bar by bar.
5. Use THIS LEG %: entering when the leg is already 120%+ of average is chasing; look for the next rotation instead.
---------------------------------------------------------------------
4. MAIN INPUTS
---------------------------------------------------------------------
MaxBars History depth (0 = all bars)
SwingBars Consecutive bars needed to turn the swing (1 = classic; 2-3 = slower "main trend" charts)
OutsideMode WAIT (classic) or resolve outside bars by close
EqualPips Equal high/low tolerance in pips (default 3; set 0 for strict textbook rules)
UseCurrentBar Let the forming bar flip the swing (off = classic non-repainting behaviour, recommended)
UnitSize/Suffix Override distance units, e.g. UnitSize 0.1 + Suffix "pips" if you count gold in 0.10 pips
Up/DnLineColor Leg colors (set both the same for the classic single-color look)
ShowLabels Pivot price labels; LabelPips adds the swing size in brackets
ShowTrendSignals Arrows when price breaks the prior pivot HTFEnable/Period Higher-timeframe overlay; AUTO = next higher TF
ShowPanel/corner The dashboard and where it sits
StatsSwings How many completed swings feed the statistics
AlertPopup/Push Alert when a swing turn confirms (on bar close)
---------------------------------------------------------------------
5. GOOD TO KNOW
---------------------------------------------------------------------
- Confirmed pivots do not repaint. The developing leg (and its HTF equivalent) naturally extends until a turn confirms - that is how every swing chart works.
- Different brokers cut daily bars at different GMT offsets, so pivots can differ slightly between brokers on the same pair. That is the data, not the indicator.
- The dashboard state (minimized / help) resets when the indicator reloads or the timeframe changes.
- Works on any symbol and timeframe. On MN1 charts there is no higher timeframe, so the overlay row shows "n/a".
Happy trading,
Thanks to Firesword and Cagliostro.
Update:
I have learned so much from the free resources and the source available here so I am sharing the source as I believe that sharing is caring.
I hope seniors/ more experienced coders can enhance it further and share for the benefit of community.
- These users thanked the author mazibee for the post (total 13):
- Cagliostro, Akela, emanuelmb10, kvak, Tsar, firesword, ricosuaveiii, ashdays, elvenso, JimKuba, Nik123, Lucas, stcash
Re: Gann Swing Chart for MT4
8I knew the very first time I came across this forum
that it felt different. It just felt right.
But the amount of support and willingness to
help one another in this place is amazing.
I thank God for leading me to this place.
Cagliostro, my good man... you are a beautiful soul.
Thank God I came across your path.
The amount of your precious time you share with this community without asking anything in return
is unbelievable. You are a true gem. I mean that
from the bottom of my heart .
Mazibee my good man, the same goes to you.
Thank you both very much for your work.
God bless you both and your loved ones.
that it felt different. It just felt right.
But the amount of support and willingness to
help one another in this place is amazing.
I thank God for leading me to this place.
Cagliostro, my good man... you are a beautiful soul.
Thank God I came across your path.
The amount of your precious time you share with this community without asking anything in return
is unbelievable. You are a true gem. I mean that
from the bottom of my heart .
Mazibee my good man, the same goes to you.
Thank you both very much for your work.
God bless you both and your loved ones.
- These users thanked the author firesword for the post (total 7):
- Cagliostro, kudrpenk, ricosuaveiii, kvak, mazibee, fnz, EverGreen
As you get older 3 things happen. The first is your memory goes, and I can't remember the other two.
Re: Gann Swing Chart for MT4
9All right friends.
Now that we have the power of Gann swing charts with us,
let's take a look at GBPAUD weekly trend .
The trend according to the swing chat is up.
Is it smart to short it then?
Let's analyze this, shall we?
Gann said that the safest place to buy is on the first higher swing bottom,
and the safest place to sell is at the first lower swing top.
On the weekly GBPAUD 3 weeks ago we had confirmed 1st higher swing bottom.
This points to higher prices on GBPAUD.
The last swing range from the bottom up was 584 pips.
Currently the range up to the last week top is 570 pips, almost 100% of the previous range.
This means we may be due for a pullback.
The last pullback of 584 pips range was 353 pips.
That is 60%, not quite 62.5% but close enough.
If we have the same pullback this time we would get 342 pips on the way down
That would give us a target of 1.9020 low.
If we get a 50% pullback that would take us to 1.9078 low.
After a 50% pullback a 100% range up would take us to 1.9635, some 557 pips.
A 100% range from 62.5% pullback would give us a 100% range up to 1.9560.
Now that we have our price targets let's see what happens.
Now that we have the power of Gann swing charts with us,
let's take a look at GBPAUD weekly trend .
The trend according to the swing chat is up.
Is it smart to short it then?
Let's analyze this, shall we?
Gann said that the safest place to buy is on the first higher swing bottom,
and the safest place to sell is at the first lower swing top.
On the weekly GBPAUD 3 weeks ago we had confirmed 1st higher swing bottom.
This points to higher prices on GBPAUD.
The last swing range from the bottom up was 584 pips.
Currently the range up to the last week top is 570 pips, almost 100% of the previous range.
This means we may be due for a pullback.
The last pullback of 584 pips range was 353 pips.
That is 60%, not quite 62.5% but close enough.
If we have the same pullback this time we would get 342 pips on the way down
That would give us a target of 1.9020 low.
If we get a 50% pullback that would take us to 1.9078 low.
After a 50% pullback a 100% range up would take us to 1.9635, some 557 pips.
A 100% range from 62.5% pullback would give us a 100% range up to 1.9560.
Now that we have our price targets let's see what happens.
As you get older 3 things happen. The first is your memory goes, and I can't remember the other two.
Re: Gann Swing Chart for MT4
10Hello mazibee.
I've noticed some swing lines missing.
I think this is due to a large outside bar so all the following bars inside of it are ignored.
Would it be possible to make the swing chart turn when two consecutive bars inside the outside bar ,
make higher high and higher low or lower high and lower low.
I attached a pic of Daily CADJPY with zigzag-ed line to visually present what I mean.
I hope I'm not too annoying with these requests.
Thank you.
God bless.
I've noticed some swing lines missing.
I think this is due to a large outside bar so all the following bars inside of it are ignored.
Would it be possible to make the swing chart turn when two consecutive bars inside the outside bar ,
make higher high and higher low or lower high and lower low.
I attached a pic of Daily CADJPY with zigzag-ed line to visually present what I mean.
I hope I'm not too annoying with these requests.
Thank you.
God bless.
As you get older 3 things happen. The first is your memory goes, and I can't remember the other two.