For MT4, please go here:
volume-indicators-for-mt4-t8460390.html
For MT5, please go here:
mt5-volume-indicators-t8474594.html
Re: Volume Indicators for cTrader
2Cumulative Volume Delta
Links: |MT4a|MT4b|MT5|cTrader|
Coder: EarnForex
Released date: Nov. 10, 2025
Cumulative Volume Delta (CVD) is an indicator for MT4 that is based on calculating the difference (delta) between buy and sell volumes to spot trend exhaustions early. The indicator calculates buy/sell volume difference over a given number of bars and presents it either in raw form or smoothed as a histogram. Green bars mean that there was more buy volume during the period while red bars mean that there was more sell volume.
Although it would be a stretch to call this CVD indicator a multi-timeframe one, it can draw buy/sell volume data from lower timeframes (which is a more accurate way to calculate Cumulative Volume Delta). This isn't always practical due to lower timeframe data availability issues. If you attach this indicator to a higher timeframe and select a very low source timeframe for volume data, it might not display anything useful. In that case, it is recommended to increase the source timeframe.
Input parameters
Source timeframe for volume data: a lower timeframe to source price and volume data for the indicator's calculations. If a higher timeframe is given the current one will be used instead.
Period for cumulative delta calculation: the size of the sliding window to cumulate the volume delta on.
Smoothing method: the method for the smoothing moving average.
Smoothing period: the period of the smoothing moving average.
Watch the divergences.
- These users thanked the author Banzai for the post (total 4):
- forexjoe85, Abdi, plon123, vasilistsr
- Rating: 2.4%
Re: Volume Indicators for cTrader
3Free Volume Profile v2.0
Volume Profile is a Horizontal histogram that overlaid on the Chart.
Volume Profile helps you see a Graphical representation of where price has been most of the day and this includes highlights of peak Volume areas and mean value areas, so basically you can see where the most action is happening price and sorted in price action. The Volume Profile is a Visual representation of the volume at each price level over a certain time period.
It provides a Unique take on the old concepts of support and resistance but trading activity and participation, value areas and fair prices and trading signals. This is because it shows how much trading has occurred at each Price Level, providing a way to discern the psychology behind the Market’s movements, and helping Traders make well-guided decisions.
Support and Resistance levels are essential concepts in Technical Analysis [TA]
They indicate price levels that a stock has previously had difficulty moving beyond. Areas of high volume are frequently considered levels of Support or Resistance. This is because these are the price levels where a large amount of trading activity has taken place, indicating strong interest from traders.
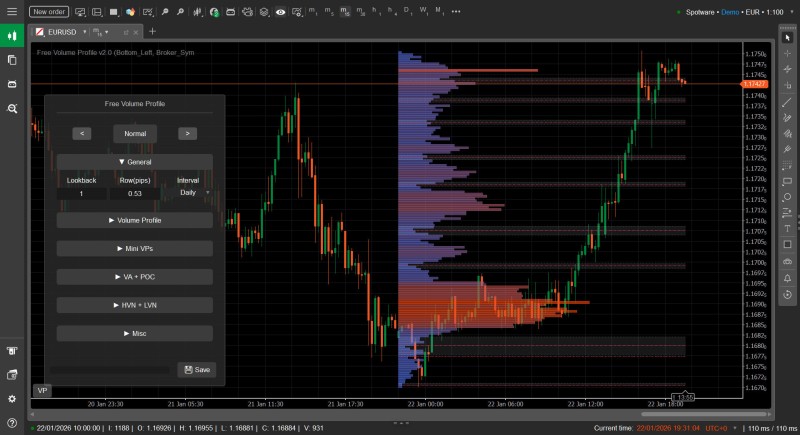
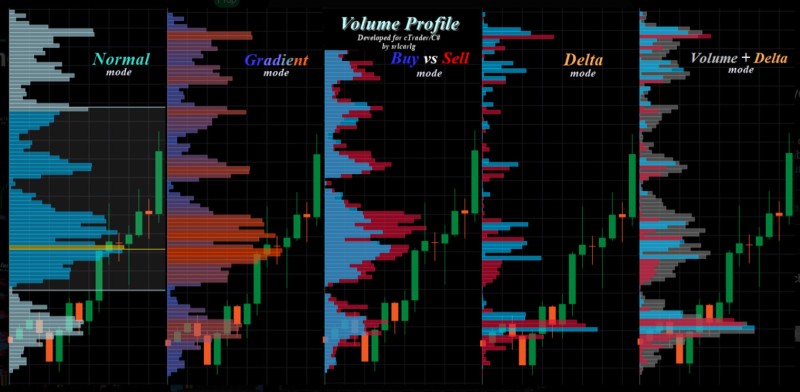
The Advantage is can Choice several Displays in the Main Menu setting. There are Options as below :
Volume Profile is a Horizontal histogram that overlaid on the Chart.
Volume Profile helps you see a Graphical representation of where price has been most of the day and this includes highlights of peak Volume areas and mean value areas, so basically you can see where the most action is happening price and sorted in price action. The Volume Profile is a Visual representation of the volume at each price level over a certain time period.
It provides a Unique take on the old concepts of support and resistance but trading activity and participation, value areas and fair prices and trading signals. This is because it shows how much trading has occurred at each Price Level, providing a way to discern the psychology behind the Market’s movements, and helping Traders make well-guided decisions.
Support and Resistance levels are essential concepts in Technical Analysis [TA]
They indicate price levels that a stock has previously had difficulty moving beyond. Areas of high volume are frequently considered levels of Support or Resistance. This is because these are the price levels where a large amount of trading activity has taken place, indicating strong interest from traders.
The Advantage is can Choice several Displays in the Main Menu setting. There are Options as below :
- These users thanked the author Tsar for the post (total 3):
- Krunal Gajjar, boytoy, Banzai
- Rating: 1.8%
Always looking the GREAT, never left GOOD Point...


