The same problem for me. only show Green and Red bars. The attached version seems to work well for me.Thanks Mr Toolsmrtools wrote: Wed Sep 10, 2025 5:53 am Added kind of sma average multiplier, the default setting was 1.5, seems that the less the number the more sensitive the signals are.
Re: MT5 Volume indicators
52Cumulative Volume Delta
(on/off button)
Links: |MT4a|MT4b|MT5|cTrader|
Cumulative Volume Delta (CVD) is an indicator for MT5 that is based on calculating the difference (delta) between buy and sell volumes to spot trend exhaustions early. The indicator calculates buy/sell volume difference over a given number of bars and presents it either in raw form or smoothed as a histogram. Green bars mean that there was more buy volume during the period while red bars mean that there was more sell volume.
In MT5, it is possible to switch to real volume if your broker provides real volume data.
Although it would be a stretch to call this CVD indicator a multi-timeframe one, it can draw buy/sell volume data from lower timeframes (which is a more accurate way to calculate Cumulative Volume Delta). This isn't always practical due to lower timeframe data availability issues. If you attach this indicator to a higher timeframe and select a very low source timeframe for volume data, it might not display anything useful. In that case, it is recommended to increase the source timeframe.
Input parameters
Source timeframe for volume data: a lower timeframe to source price and volume data for the indicator's calculations. If a higher timeframe is given the current one will be used instead.
Period for cumulative delta calculation: the size of the sliding window to cumulate the volume delta on.
Smoothing method: the method for the smoothing moving average.
Smoothing period: the period of the smoothing moving average.
Volume type: can be either tick or real volume. This option is only available in MetaTrader 5 version of the indicator. Real volume is usually unavailable for Forex/CFD instruments.
Watch the divergences.
(on/off button)
Links: |MT4a|MT4b|MT5|cTrader|
Cumulative Volume Delta (CVD) is an indicator for MT5 that is based on calculating the difference (delta) between buy and sell volumes to spot trend exhaustions early. The indicator calculates buy/sell volume difference over a given number of bars and presents it either in raw form or smoothed as a histogram. Green bars mean that there was more buy volume during the period while red bars mean that there was more sell volume.
In MT5, it is possible to switch to real volume if your broker provides real volume data.
Although it would be a stretch to call this CVD indicator a multi-timeframe one, it can draw buy/sell volume data from lower timeframes (which is a more accurate way to calculate Cumulative Volume Delta). This isn't always practical due to lower timeframe data availability issues. If you attach this indicator to a higher timeframe and select a very low source timeframe for volume data, it might not display anything useful. In that case, it is recommended to increase the source timeframe.
Input parameters
Source timeframe for volume data: a lower timeframe to source price and volume data for the indicator's calculations. If a higher timeframe is given the current one will be used instead.
Period for cumulative delta calculation: the size of the sliding window to cumulate the volume delta on.
Smoothing method: the method for the smoothing moving average.
Smoothing period: the period of the smoothing moving average.
Volume type: can be either tick or real volume. This option is only available in MetaTrader 5 version of the indicator. Real volume is usually unavailable for Forex/CFD instruments.
Watch the divergences.
Re: MT5 Volume indicators
53Thanks soo much for the indicator. Is there any MT4 version to share?Banzai wrote: Thu Nov 27, 2025 12:11 pm Cumulative Volume Delta
(on/off button)
Cumulative Volume Delta (CVD) is an indicator for MT5 that is based on calculating the difference (delta) between buy and sell volumes to spot trend exhaustions early. The indicator calculates buy/sell volume difference over a given number of bars and presents it either in raw form or smoothed as a histogram. Green bars mean that there was more buy volume during the period while red bars mean that there was more sell volume.
In MT5, it is possible to switch to real volume if your broker provides real volume data.
Although it would be a stretch to call this CVD indicator a multi-timeframe one, it can draw buy/sell volume data from lower timeframes (which is a more accurate way to calculate Cumulative Volume Delta). This isn't always practical due to lower timeframe data availability issues. If you attach this indicator to a higher timeframe and select a very low source timeframe for volume data, it might not display anything useful. In that case, it is recommended to increase the source timeframe.
Input parameters
Source timeframe for volume data: a lower timeframe to source price and volume data for the indicator's calculations. If a higher timeframe is given the current one will be used instead.
Period for cumulative delta calculation: the size of the sliding window to cumulate the volume delta on.
Smoothing method: the method for the smoothing moving average.
Smoothing period: the period of the smoothing moving average.
Volume type: can be either tick or real volume. This option is only available in MetaTrader 5 version of the indicator. Real volume is usually unavailable for Forex/CFD instruments.
Re: MT5 Volume indicators
54Yes, it's over here:cladi53 wrote: Thu Nov 27, 2025 12:20 pm Thanks soo much for the indicator. Is there any MT4 version to share?
post1295576815.html#p1295576815
Re: MT5 Volume indicators
55DeltaFusionLite
Coder: Francesco Secchi
Date: Dec. 5, 2025
Cumulative Delta: Tracks aggregated buy and sell volume over time.
Net Delta: Shows the difference between buying and selling pressure for each bar.
Session Reset: Allows custom session start times for intraday analysis.
Smoothing: Includes EMA smoothing for cleaner and more readable delta curves.
Purpose:
Ideal for traders who want to monitor order flow dynamics, volume imbalances, and divergences between price and delta without complex multi-timeframe calculations. It’s lightweight, fast, and focused on essential delta metrics.
Examples of Divergences Detectable with DeltaFusion Lite:
Bullish Divergence
Price makes new lows, but Net Delta shows higher lows → selling pressure is weakening, possible bullish reversal.
Bearish Divergence
Price makes new highs, but Net Delta shows lower highs → buying pressure is fading, possible bearish reversal.
Hidden Divergence
Price makes a higher low, while Cumulative Delta makes a lower low → confirms continuation of the bullish trend.
Exhaustion Divergence
Strong price movement without confirmation in delta → indicates low participation, possible correction ahead.
Code: Select all
https://www.mql5.com/en/code/66864Date: Dec. 5, 2025
Cumulative Delta: Tracks aggregated buy and sell volume over time.
Net Delta: Shows the difference between buying and selling pressure for each bar.
Session Reset: Allows custom session start times for intraday analysis.
Smoothing: Includes EMA smoothing for cleaner and more readable delta curves.
Purpose:
Ideal for traders who want to monitor order flow dynamics, volume imbalances, and divergences between price and delta without complex multi-timeframe calculations. It’s lightweight, fast, and focused on essential delta metrics.
Examples of Divergences Detectable with DeltaFusion Lite:
Bullish Divergence
Price makes new lows, but Net Delta shows higher lows → selling pressure is weakening, possible bullish reversal.
Bearish Divergence
Price makes new highs, but Net Delta shows lower highs → buying pressure is fading, possible bearish reversal.
Hidden Divergence
Price makes a higher low, while Cumulative Delta makes a lower low → confirms continuation of the bullish trend.
Exhaustion Divergence
Strong price movement without confirmation in delta → indicates low participation, possible correction ahead.
Re: MT5 Volume indicators
56Hello, this is conversion of MT4 indicator
KVO.
Two version, one is with divergences.
coloring based on slope, zero or signal cross.
KVO.
Two version, one is with divergences.
coloring based on slope, zero or signal cross.
- These users thanked the author kvak for the post (total 6):
- Dimkin, RodrigoRT7, JimKuba, Krunal Gajjar, Ricstar_8, Eis
"fear moves faster than greed"
Re: MT5 Volume indicators
57Thank You Kvak. I am experiencing a problem with the divergences in the sub-window. Could you check it please?
Re: MT5 Volume indicators
58Hi Kvak, I have added a couple of screenshots of the divergence nonalignment in the sub-window. Any idea what is causing this. Thanks Again
Re: MT5 Volume indicators
59Yes, thanks.Ricstar_8 wrote: Tue Jun 30, 2026 9:34 am Hi Kvak, I have added a couple of screenshots of the divergence nonalignment in the sub-window. Any idea what is causing this. Thanks Again
It is look that MT5 code for divergences not perfect for now, I am must optimised it.
BTW I am tested this indicator for 3 hours in different instruments and dont see this bug....
"fear moves faster than greed"
 CVD Divergence
60
CVD Divergence indicator for MT5
This indicator estimates buying and selling pressure to spot **hidden trend reversals** (divergences) before price turns.
Happy PiP$.
PS: If you require a version compiled in X64, please see here.
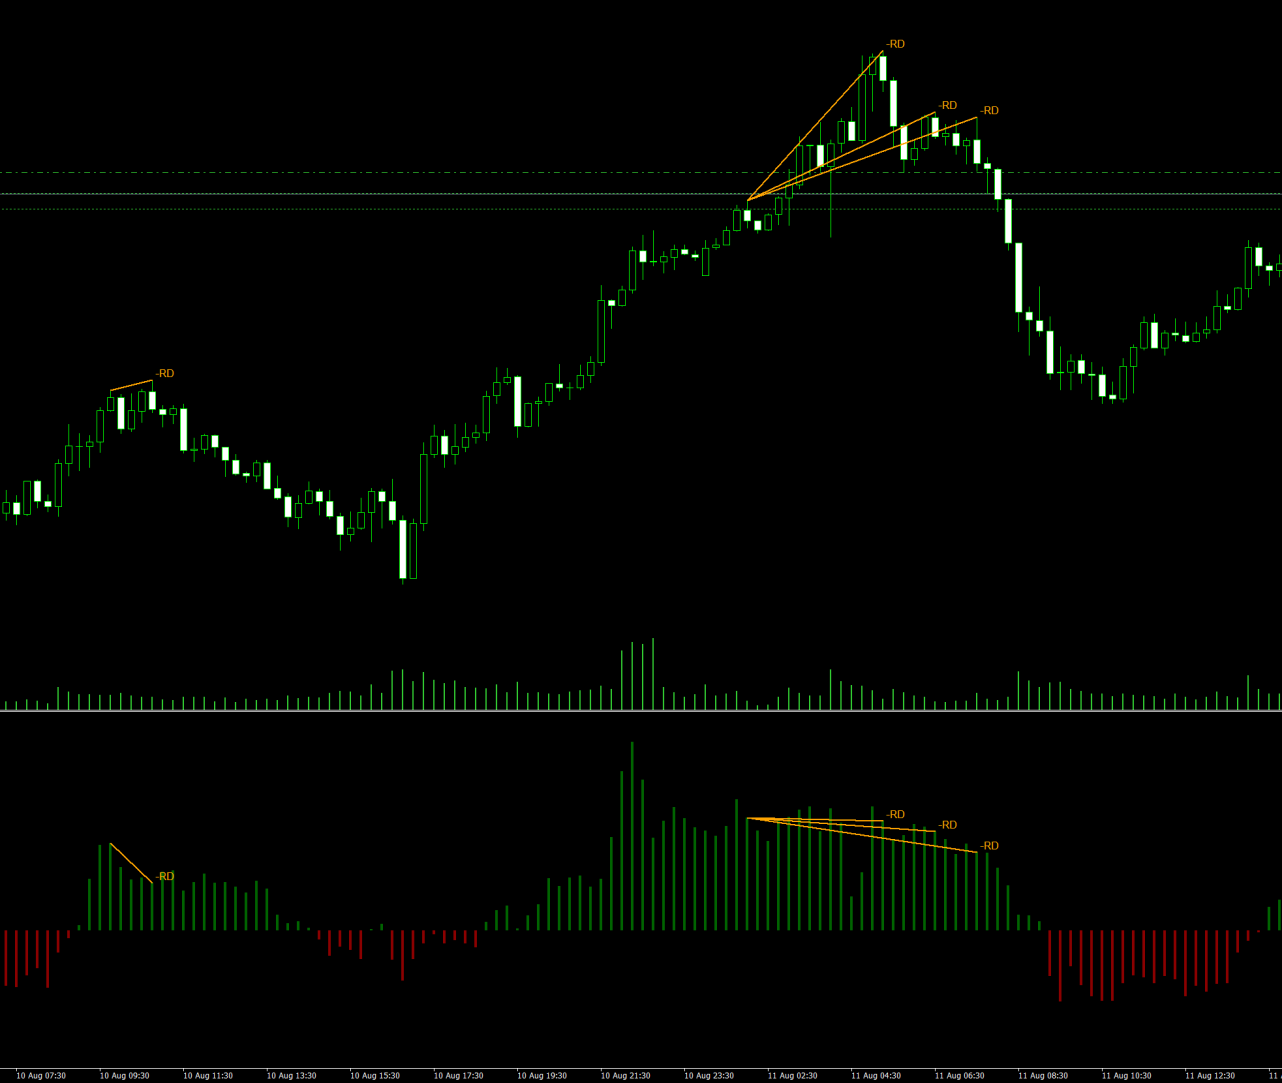
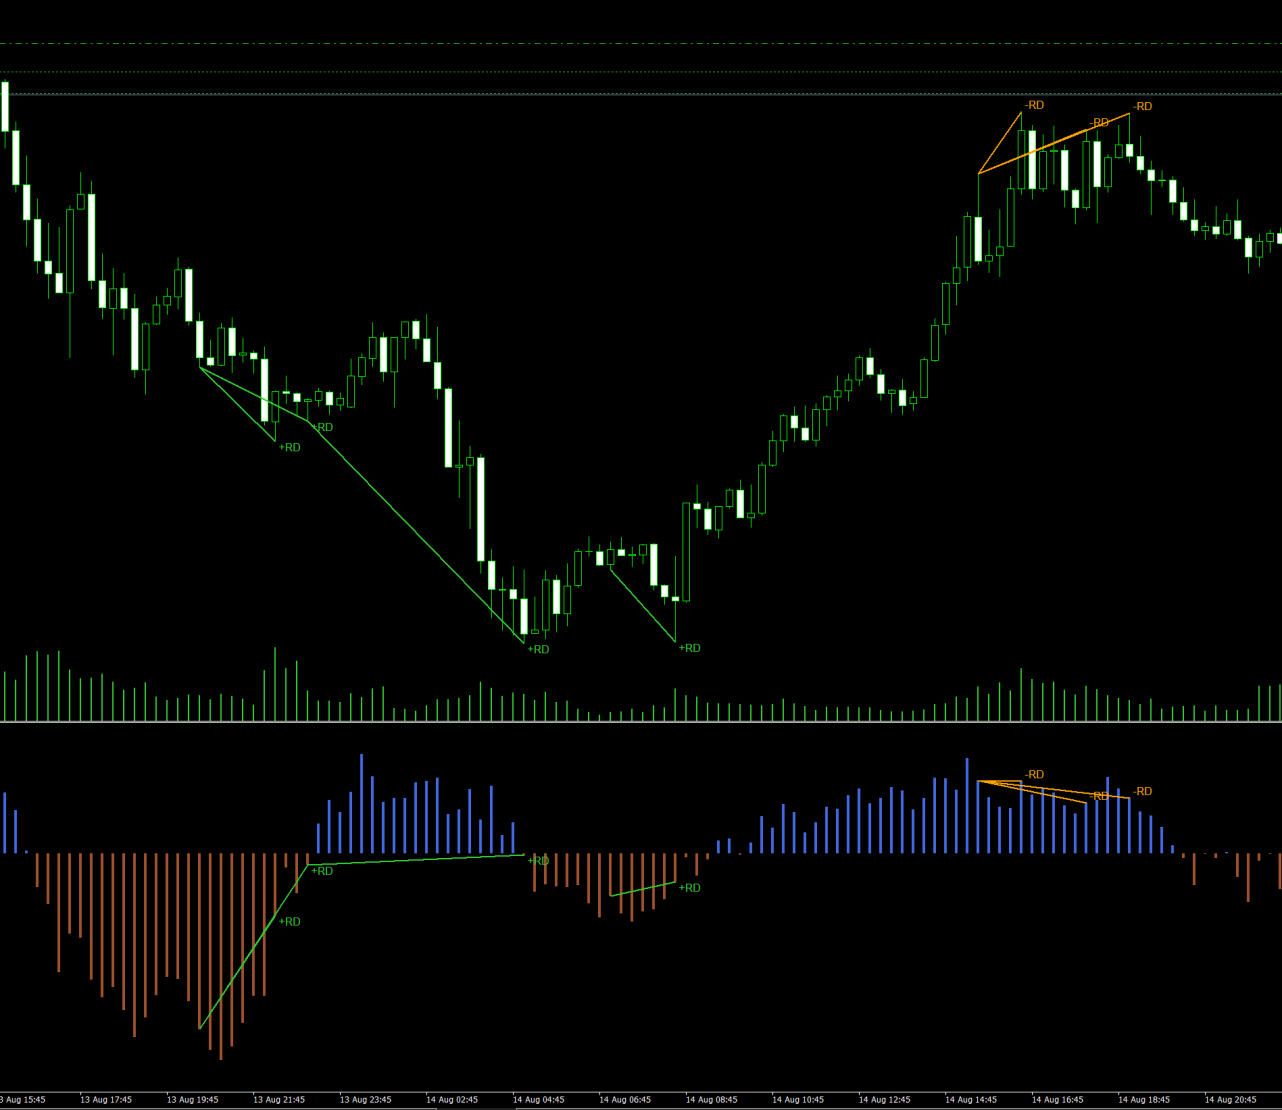
This indicator estimates buying and selling pressure to spot **hidden trend reversals** (divergences) before price turns.
- Calculates Estimated Cumulative Volume Delta (CVD): Estimates whether buyers or sellers were in control during each candle based on where price closed relative to the candle's High-Low range.
- Displays a Dual-Color Histogram: Plots a histogram in a separate window below the chart—Green for positive volume delta (buying pressure) and Red for negative volume delta (selling pressure).
- Detects Divergences Automatically: Scans price swing points (fractals) against CVD levels:
- Bullish Divergence (`+RD`): Price drops to a lower low, but buying volume rises (higher low in CVD). Signals a potential upward reversal.
- Bearish Divergence (`-RD`): Price pushes to a higher high, but buying volume fades (lower high in CVD). Signals a potential downward reversal.
Happy PiP$.
PS: If you require a version compiled in X64, please see here.


