Re: MT4 Candlesticks, Patterns, Correlation, Breakouts & Price Action indicators

311
Banzai wrote: Sat Feb 22, 2025 3:26 pm Candle Display

Coder: cja
Released date: Mar. 17, 2021
Description: Display higher time frame candles.


This trader will show us how to trade M15 charts with H4 candlesticks.
and H4 charts with Weekly candlesticks.

For MT5, please go here:
post1295576762.html#p1295576762
ס₪₪₪₪§|(Ξ≥≤≥≤≥≤ΞΞΞΞΞΞΞΞΞΞΞΞΞΞΞΞΞΞΞΞΞΞΞΞΞΞΞΞΞΞΞΞΞΞΞΞΞΞΞΞΞΞΞΞΞΞΞΞΞΞΞΞΞΞΞΞΞΞΞΞΞΞΞΞΞΞΞΞΞΞΞΞΞΞΞΞΞ>
DOWNLOAD:
M-Candles BT.mq4
These users thanked the author Banzai for the post (total 3):
sal, Abdi, MARCOSERRANO

Re: MT4 Candlesticks, Patterns, Correlation, Breakouts & Price Action indicators

315
M̳-̳C̳a̳n̳d̳l̳e̳s̳
(on/off button)

Please use this version.
This indicator supports higher-timeframe candle display.

It is a single indicator that includes 9 on/off buttons,
one for each timeframe.

The colors of the higher-timeframe candles are user-configurable.

For MT5, please go here:
post1295577386.html#p1295577386
These users thanked the author Banzai for the post (total 8):
mazibee, ricosuaveiii, Tsar, talaate, Abdi, dienone, Knight, MARCOSERRANO

Re: MT4 Candlesticks, Patterns, Correlation, Breakouts & Price Action indicators

316
PeriodBodyHighLowMid v2.11


PeriodBodyHighLowMid v2.11 is a Custom technical indicator for the MetaTrader 4 (MT4) platform.
It is designed to Identify and Visualize key price levels — High, Low, Midpoint, and Body boundaries — across a Specific time period or set of Candles.


* Core Functions :

The indicator typically calculates and draws Horizontal lines or Labels for the following :
  • High/Low Calculation :
    Identifies the Highest and Lowest prices reached during a Specific timeframe or Number of Candles.
  • Midpoint (Median) Calculation :
    The exact 50% Level between the Period's High and Low, often used as a "Fair value" or Pivot area.
  • Body High & Low Range Tracking :
    Unlike standard High/Low indicators, this Specific Version calculates the Highest and Lowest Close or Open (the "Candle bodies") within the Period, ignoring the Wicks. This helps Traders identify where the most substantial Price Action occurred.

** Typical Applications :
  • Identify Ranges :
    Spot consolidation zones where the "Body High" and "Body Low" act as Strong Support and Resistance.
  • Trade Breakouts :
    Enter Trades when Price closes outside the Body High/Low or the absolute High/Low boundaries.
  • Trend Confirmation :
    Use the Midpoint as a Dynamic bias indicator ;
    Price staying above the Midpoint is Generally considered 'Bullish' & Price staying below the Midpoint is Generally considered Bearish for that period.


*** Common Uses for Traders :
  • Breakout Trading :
    Traders watch for Price to break above the "High" or below the "Low" of the previous period.
  • Mean Reversion :
    The "Mid" line often acts as a Magnet for Price ; Traders look for Entries when price deviates significantly from this Median.
  • Volatility Analysis :
    The distance between the High and Low lines provides a Quick visual of Market volatility over that period.
These users thanked the author Tsar for the post (total 2):
MARCOSERRANO, Abdi
Always looking the GREAT, never left GOOD Point...

Re: MT4 Candlesticks, Patterns, Correlation, Breakouts & Price Action indicators

317
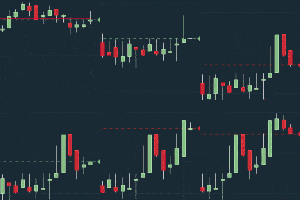
PeriodBodyHighLowMid v3.00


PeriodBodyHighLowMid v3.00 is a Custom technical indicator for the MetaTrader 4 (MT4) platform.
It is designed to Identify and Visualize key price levels — High, Low, Midpoint, WICK and Body boundaries — across a Specific time period or set of Candles.


* Core Functions :

The indicator typically calculates and draws Horizontal lines or Labels for the following :
  • High/Low Calculation :
    Identifies the Highest and Lowest prices reached during a Specific timeframe or Number of Candles.
  • Midpoint (Median) Calculation :
    The exact 50% Level between the Period's High and Low, often used as a "Fair value" or Pivot area.
  • Body High & Low Range Tracking :
    Unlike standard High/Low indicators, this Specific Version calculates the Highest and Lowest Close or Open (the "Candle bodies") within the Period, ignoring the Wicks. This helps Traders identify where the most substantial Price Action occurred.
"PeriodBodyHighLowMid v3.00 version" ADDED :
    • WICK High/Low & Mid Calculation :
      Identifies the Higher HIGH (HH) and Lower LOW (LL) prices reached during a Specific timeframe
      --- before 'the Candle closed' outside the Absolute Highest / Lowest limit.
These users thanked the author Tsar for the post (total 7):
Jimmy, Banzai, MARCOSERRANO, Brinol, JohnL33, Abdi, kudrpenk
Always looking the GREAT, never left GOOD Point...