Please read the first post and follow the instructions.

Re: Already Converted TradingView Indicators to MT4 Indicators
672Hello! Can you help me with this?
https://www.tradingview.com/script/791W ... r/page-26/
https://www.tradingview.com/script/791W ... r/page-26/
Code: Select all
// This source code is subject to the terms of the Mozilla Public License 2.0 at https://mozilla.org/MPL/2.0/
// © blackcat1402
//@version=5

indicator('[blackcat] L3 Banker Fund Flow Trend Oscillator', overlay=false)

// Function to find the most recent non-NaN value within a given length
find_recent_value(values, length) =>
    recent_value = float(na)
    if length >= 1
        for i = 0 to length by 1
            if na(recent_value) or not na(values[i])
                recent_value := values[i]
                recent_value
    recent_value

// Function to calculate a weighted simple average
calculate_weighted_simple_average(src, length, weight) =>
    sum_float = 0.0
    moving_average = 0.0
    output = 0.0
    sum_float := nz(sum_float[1]) - nz(src[length]) + src
    moving_average := na(src[length]) ? na : sum_float / length
    output := na(output[1]) ? moving_average : (src * weight + output[1] * (length - weight)) / length
    output

// Function to calculate banker fund flow trend, bull bear line, and entry signal
calculate_banker_fund_flow(close, low, high, open) =>
    // Define typical price for banker fund
    typical_price = (2 * close + high + low + open) / 5

    // Lowest low with mid-term Fibonacci level 34
    lowest_low = ta.lowest(low, 34)

    // Highest high with mid-term Fibonacci level 34
    highest_high = ta.highest(high, 34)

    // Set up a simple model of banker fund flow trend
    fund_flow_trend = (3 * calculate_weighted_simple_average((close - ta.lowest(low, 27)) / (ta.highest(high, 27) - ta.lowest(low, 27)) * 100, 5, 1) - 2 * calculate_weighted_simple_average(calculate_weighted_simple_average((close - ta.lowest(low, 27)) / (ta.highest(high, 27) - ta.lowest(low, 27)) * 100, 5, 1), 3, 1) - 50) * 1.032 + 50

    // Define banker fund flow bull bear line
    bull_bear_line = ta.ema((typical_price - lowest_low) / (highest_high - lowest_low) * 100, 13)

    // Define banker entry signal
    banker_entry_signal = ta.crossover(fund_flow_trend, bull_bear_line) and bull_bear_line < 25

    // Return the calculated values
    [fund_flow_trend, bull_bear_line, banker_entry_signal]

// Calculate banker fund flow values
[fund_flow_trend, bull_bear_line, banker_entry_signal] = calculate_banker_fund_flow(close, low, high, open)

// Banker fund entry with yellow candle
plotcandle(0, 50, 0, 50, color=banker_entry_signal ? color.new(color.yellow, 0) : na, bordercolor=na)

// Banker increase position with green candle
plotcandle(fund_flow_trend, bull_bear_line, fund_flow_trend, bull_bear_line, color=fund_flow_trend > bull_bear_line ? color.new(color.green, 0) : na, bordercolor=na)

// Banker decrease position with white candle
plotcandle(fund_flow_trend, bull_bear_line, fund_flow_trend, bull_bear_line, color=fund_flow_trend < find_recent_value(fund_flow_trend * 0.95, 1) ? color.new(color.white, 0) : na, bordercolor=na)

// Banker fund exit/quit with red candle
plotcandle(fund_flow_trend, bull_bear_line, fund_flow_trend, bull_bear_line, color=fund_flow_trend < bull_bear_line ? color.new(color.red, 0) : na, bordercolor=na)

// Banker fund Weak rebound with blue candle
plotcandle(fund_flow_trend, bull_bear_line, fund_flow_trend, bull_bear_line, color=fund_flow_trend < bull_bear_line and fund_flow_trend > find_recent_value(fund_flow_trend * 0.95, 1) ? color.new(color.blue, 0) : na, bordercolor=na)

// Overbought and oversold threshold lines
overbought_threshold = hline(80, color=color.red, linestyle=hline.style_dotted)
oversold_threshold = hline(20, color=color.yellow, linestyle=hline.style_dotted)
weak_threshold = hline(10, color=color.lime, linestyle=hline.style_dotted)
strong_threshold = hline(90, color=color.fuchsia, linestyle=hline.style_dotted)
fill(oversold_threshold, weak_threshold, color=color.new(color.yellow, 70))
fill(overbought_threshold, strong_threshold, color=color.new(color.fuchsia, 70))

// Alerts
alertcondition(banker_entry_signal, title='Alert on Yellow Candle', message='Yellow Candle!')
alertcondition(fund_flow_trend > bull_bear_line, title='Alert on Green Candle', message='Green Candle!')
alertcondition(fund_flow_trend < find_recent_value(fund_flow_trend * 0.95, 1), title='Alert on White Candle', message='White Candle!')
alertcondition(fund_flow_trend < bull_bear_line, title='Alert on Red Candle', message='Red Candle!')
alertcondition(fund_flow_trend < bull_bear_line and fund_flow_trend > find_recent_value(fund_flow_trend * 0.95, 1), title='Alert on Blue Candle', message='Blue Candle!')
 Re: Already Converted TradingView Indicators to MT4 Indicators
673
Dear mrtools, kvak, Banzai or Other Coders.
Need your Help convert this TV Script indicator;s to MT4 please...
There is very Interesting of the New Concept & inspired by BigBeluga :
Supply Demand (include Support Resistance) with Base of Volume (combine POC + Heatmap bars of Market Profile) and Add Fibo Calculation's.
Dynamic Liquidity HeatMap Profile [BigBeluga]
![Dynamic Liquidity HeatMap Profile [BigBeluga].jpg](https://forex-station.com/download/file.php?id=3523577&t=1)
Explaint in :
https://www.tradingview.com/v/qWvJ0jlj
Need your Help convert this TV Script indicator;s to MT4 please...

There is very Interesting of the New Concept & inspired by BigBeluga :
Supply Demand (include Support Resistance) with Base of Volume (combine POC + Heatmap bars of Market Profile) and Add Fibo Calculation's.
Dynamic Liquidity HeatMap Profile [BigBeluga]
Code: Select all
// This Pine Script® code is subject to the terms of the Mozilla Public License 2.0 at https://mozilla.org/MPL/2.0/
// © BigBeluga

//@version=6
indicator("Dynamic Liquidity HeatMap Profile [BigBeluga]", overlay = true, max_lines_count = 500, max_bars_back = 2000, max_boxes_count = 500)

// INPUTS ――――――――――――――――――――――――――――――――――――――――――――――――――――――――――――――――――――――――――――――――――――――――――――――――――――――――{
lookBack = input.int(300, "Calculated Bars")
displPf  = input.bool(true, "Profile", group = "Profile")
bins     = input.int(50, "Resolution", group = "Profile")
resolution = 100

color sellColor = input.color(color.blue, "Sell Liquidity")
color buyColor  = input.color(color.lime, "Buy  Liquidity")
bool  poc       = input.bool(true, "", inline = "maxp")
color maxColor  = input.color(color.orange, "Max Point Liquidity", inline = "maxp")


var boxes       = array.new<box>()
var labels      = array.new<label>()
var lines       = array.new<line>()

var volume_bins = array.new<float>(bins, 0.)
h_l         = array.new<float>()


type pivot
    float value
    int   index
    float volume_
    float vol
    bool isLower

var pivots = array.new<pivot>()


// CALCULATIONS――――――――――――――――――――――――――――――――――――――――――――――――――――――――――――――――――――――――――――――――――――――――――――――{
h = ta.highest(2)
l = ta.lowest(2)

volumeArr = array.new_float(lookBack)

vol  = math.sum(volume, 10)

for i = 0 to lookBack-1
    volumeArr.set(i, vol[i])

nVol   = vol / volumeArr.max() * 100
atr    = ta.atr(5) / 50
offset = ta.highest(atr * nVol, lookBack)

for i = 0 to lookBack-1

    h_l.push(high[i]+offset[i])
    h_l.push(low[i]-offset[i])


if last_bar_index - bar_index < lookBack

    top = h_l.max()
    bot = h_l.min()


    step = (top-bot)/resolution

    level1 = high + atr * nVol
    level2 = low  - atr * nVol


    if h == high
        for i = 0 to resolution - 1
            lower = bot + step * i
            mid   = lower + step/2

            if math.abs(level1 - mid) <= step
                pivots.push(pivot.new(mid, bar_index, nVol, vol, false))

    if l == low
        for i = 0 to resolution - 1
            lower = bot + step * i
            mid   = lower + step/2

            if math.abs(level2 - mid) <= step
                pivots.push(pivot.new(mid  - atr * nVol, bar_index, nVol, vol, true))


    if pivots.size() > 0
        for p in pivots

            y = p.value
            x = p.index
            isLow = p.isLower

            if isLow and low < y
                pivots.remove(pivots.indexof(p))

            if not isLow and high > y
                pivots.remove(pivots.indexof(p))
// }


// PLOT ――――――――――――――――――――――――――――――――――――――――――――――――――――――――――――――――――――――――――――――――――――――――――――――――――――――――――――{
if barstate.islast

    if lines.size() > 0
        for ln in lines
            ln.delete()


    for b in boxes
        b.delete()
    boxes.clear()

    for lbl in labels
        lbl.delete()
    labels.clear()

    step = (h_l.max() - h_l.min()) / bins


    for j = 0 to bins-1
        volume_bins.set(j, 0)

    if pivots.size() > 0
        for i = 0 to pivots.size() - 1
            lvl     = pivots.get(i)
            vol_    = lvl.vol
            line_y  = lvl.value

            for j = 0 to bins-1
                lower = h_l.min() + step * j
                mid   = lower + step/2
                upper = lower + step

                if math.abs(line_y-mid) < step
                    volume_bins.set(j, volume_bins.get(j) + vol_)

        for j = 0 to bins-1
            lower    = h_l.min() + step * j
            upper    = lower + step
            mid      = lower + step/2
            voll     = volume_bins.get(j)
            valueVol = voll / volume_bins.max() * 50
            col      = close > mid ? buyColor : sellColor
            m_col    = color.from_gradient(voll, volume_bins.min(), volume_bins.max(), color.new(col, 80), color.new(col, 0))
            m_col1   = color.from_gradient(voll, volume_bins.min(), volume_bins.max(), color.new(col, 50), color.new(col, 0))
            if not (close < upper and close > lower)

                if displPf and (valueVol != 0)

                    boxes.push(
                                     box.new(bar_index+20, upper, bar_index+20+int(valueVol), lower
                                     , bgcolor      = voll == volume_bins.max() and poc ? maxColor : m_col
                                     , border_color = chart.bg_color
                                     , text         = voll > volume_bins.avg() ? str.tostring(voll, format.volume) : ""
                                     , text_halign  = text.align_left)
                                     )

                    boxes.push(
                                     box.new(bar_index+20, upper, bar_index+5, lower
                                     , text = str.tostring(valueVol*2, format.percent)
                                     , bgcolor = color(na)
                                     , border_color = color(na)
                                     , text_color = voll == volume_bins.max() ? maxColor : m_col1)
                                     )


                var start = 0
                isLower = close > mid

                for i = 0 to lookBack - 1
                    if isLower
                        if low[i] < mid
                            start := bar_index - i
                            break
                        if i == lookBack - 1
                            start := bar_index - i
                            break
                    else
                        if high[i] > mid
                            start := bar_index - i
                            break
                        if i == lookBack - 1
                            start := bar_index - i
                            break

                color = voll == volume_bins.max() and poc ? maxColor : color.from_gradient(valueVol, 0, 50, color(na), isLower ? color.new(buyColor, 30) : color.new(sellColor, 30))

                lines.push(line.new(start+3, mid, bar_index+5, mid, width = int(valueVol/5), color = color))
// }
Explaint in :
https://www.tradingview.com/v/qWvJ0jlj
Always looking the GREAT, never left GOOD Point...
Re: Already Converted TradingView Indicators to MT4 Indicators
674Dynamic Liquidity HeatMap Profile [BigBeluga]
AI made this, I think there is issues, but don`t really know, so maybe coders can continue from here.
AI made this, I think there is issues, but don`t really know, so maybe coders can continue from here.
Code: Select all
// This Pine Script® code is subject to the terms of the Mozilla Public License 2.0 at https://mozilla.org/MPL/2.0/
// © BigBeluga

//@version=6
indicator("Dynamic Liquidity HeatMap Profile [BigBeluga]", overlay = true, max_lines_count = 500, max_bars_back = 2000, max_boxes_count = 500)

// INPUTS ――――――――――――――――――――――――――――――――――――――――――――――――――――――――――――――――――――――――――――――――――――――――――――――――――――――――{
lookBack = input.int(300, "Calculated Bars")
displPf  = input.bool(true, "Profile", group = "Profile")
bins     = input.int(50, "Resolution", group = "Profile")
resolution = 100

color sellColor = input.color(color.blue, "Sell Liquidity")
color buyColor  = input.color(color.lime, "Buy  Liquidity")
bool  poc       = input.bool(true, "", inline = "maxp")
color maxColor  = input.color(color.orange, "Max Point Liquidity", inline = "maxp")


var boxes       = array.new<box>()
var labels      = array.new<label>()
var lines       = array.new<line>()

var volume_bins = array.new<float>(bins, 0.)
h_l         = array.new<float>()


type pivot
    float value
    int   index
    float volume_
    float vol
    bool isLower

var pivots = array.new<pivot>()


// CALCULATIONS――――――――――――――――――――――――――――――――――――――――――――――――――――――――――――――――――――――――――――――――――――――――――――――{
h = ta.highest(2)
l = ta.lowest(2)

volumeArr = array.new_float(lookBack)

vol  = math.sum(volume, 10)

for i = 0 to lookBack-1
    volumeArr.set(i, vol[i])

nVol   = vol / volumeArr.max() * 100
atr    = ta.atr(5) / 50
offset = ta.highest(atr * nVol, lookBack)

for i = 0 to lookBack-1

    h_l.push(high[i]+offset[i])
    h_l.push(low[i]-offset[i])


if last_bar_index - bar_index < lookBack

    top = h_l.max()
    bot = h_l.min()


    step = (top-bot)/resolution

    level1 = high + atr * nVol
    level2 = low  - atr * nVol


    if h == high
        for i = 0 to resolution - 1
            lower = bot + step * i
            mid   = lower + step/2

            if math.abs(level1 - mid) <= step
                pivots.push(pivot.new(mid, bar_index, nVol, vol, false))

    if l == low
        for i = 0 to resolution - 1
            lower = bot + step * i
            mid   = lower + step/2

            if math.abs(level2 - mid) <= step
                pivots.push(pivot.new(mid  - atr * nVol, bar_index, nVol, vol, true))


    if pivots.size() > 0
        for p in pivots

            y = p.value
            x = p.index
            isLow = p.isLower

            if isLow and low < y
                pivots.remove(pivots.indexof(p))

            if not isLow and high > y
                pivots.remove(pivots.indexof(p))
// }


// PLOT ――――――――――――――――――――――――――――――――――――――――――――――――――――――――――――――――――――――――――――――――――――――――――――――――――――――――――――{
if barstate.islast

    if lines.size() > 0
        for ln in lines
            ln.delete()


    for b in boxes
        b.delete()
    boxes.clear()

    for lbl in labels
        lbl.delete()
    labels.clear()

    step = (h_l.max() - h_l.min()) / bins


    for j = 0 to bins-1
        volume_bins.set(j, 0)

    if pivots.size() > 0
        for i = 0 to pivots.size() - 1
            lvl     = pivots.get(i)
            vol_    = lvl.vol
            line_y  = lvl.value

            for j = 0 to bins-1
                lower = h_l.min() + step * j
                mid   = lower + step/2
                upper = lower + step

                if math.abs(line_y-mid) < step
                    volume_bins.set(j, volume_bins.get(j) + vol_)

        for j = 0 to bins-1
            lower    = h_l.min() + step * j
            upper    = lower + step
            mid      = lower + step/2
            voll     = volume_bins.get(j)
            valueVol = voll / volume_bins.max() * 50
            col      = close > mid ? buyColor : sellColor
            m_col    = color.from_gradient(voll, volume_bins.min(), volume_bins.max(), color.new(col, 80), color.new(col, 0))
            m_col1   = color.from_gradient(voll, volume_bins.min(), volume_bins.max(), color.new(col, 50), color.new(col, 0))
            if not (close < upper and close > lower)

                if displPf and (valueVol != 0)

                    boxes.push(
                                     box.new(bar_index+20, upper, bar_index+20+int(valueVol), lower
                                     , bgcolor      = voll == volume_bins.max() and poc ? maxColor : m_col
                                     , border_color = chart.bg_color
                                     , text         = voll > volume_bins.avg() ? str.tostring(voll, format.volume) : ""
                                     , text_halign  = text.align_left)
                                     )

                    boxes.push(
                                     box.new(bar_index+20, upper, bar_index+5, lower
                                     , text = str.tostring(valueVol*2, format.percent)
                                     , bgcolor = color(na)
                                     , border_color = color(na)
                                     , text_color = voll == volume_bins.max() ? maxColor : m_col1)
                                     )


                var start = 0
                isLower = close > mid

                for i = 0 to lookBack - 1
                    if isLower
                        if low[i] < mid
                            start := bar_index - i
                            break
                        if i == lookBack - 1
                            start := bar_index - i
                            break
                    else
                        if high[i] > mid
                            start := bar_index - i
                            break
                        if i == lookBack - 1
                            start := bar_index - i
                            break

                color = voll == volume_bins.max() and poc ? maxColor : color.from_gradient(valueVol, 0, 50, color(na), isLower ? color.new(buyColor, 30) : color.new(sellColor, 30))

                lines.push(line.new(start+3, mid, bar_index+5, mid, width = int(valueVol/5), color = color))
// }
- Rating: 0.6%
Re: Already Converted TradingView Indicators to MT4 Indicators
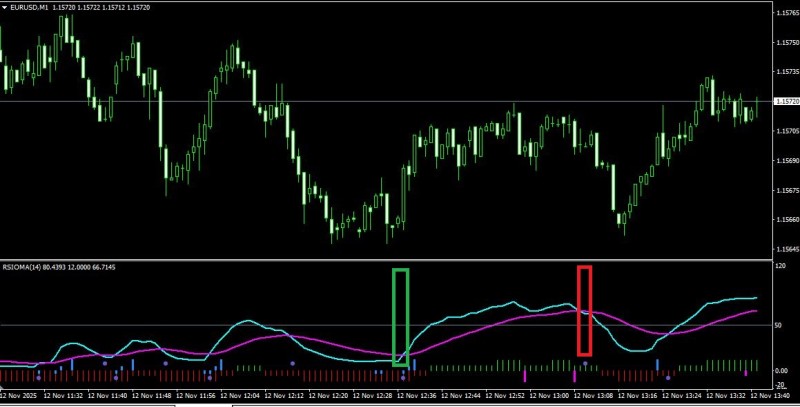
675Mr. Tools please help me for RSIOMA_v2RK indicator
1. I need Your Magical midas touch on indicator
2. Plot Red/Green bar instead of dots on positive/negative cross
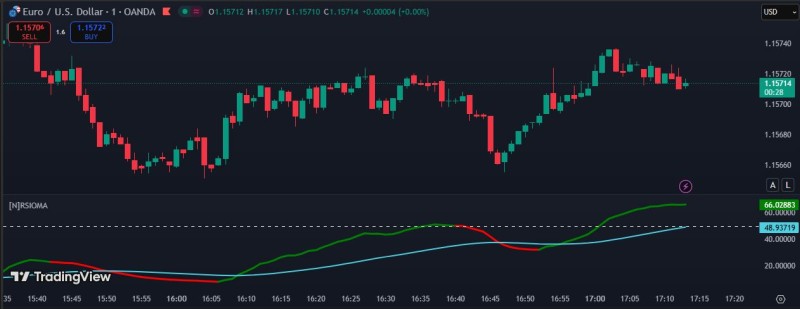
3. same indicator is available on tradingview, tv version RSI length line is red and green, can this be added in mt4 indicator ( https://in.tradingview.com/v/y9b0JI8K/ )
1. I need Your Magical midas touch on indicator
2. Plot Red/Green bar instead of dots on positive/negative cross
3. same indicator is available on tradingview, tv version RSI length line is red and green, can this be added in mt4 indicator ( https://in.tradingview.com/v/y9b0JI8K/ )
Re: Already Converted TradingView Indicators to MT4 Indicators
676The Strange Math That Predicts (Almost) Anything
https://www.tradingview.com/script/DVxI ... obability/
https://www.tradingview.com/script/DVxI ... obability/
Re: Already Converted TradingView Indicators to MT4 Indicators
677Hello, maybe try this one.srinarayani13 wrote: Wed Nov 12, 2025 10:53 pm Mr. Tools please help me for RSIOMA_v2RK indicator
1. I need Your Magical midas touch on indicator
2. Plot Red/Green bar instead of dots on positive/negative cross
3. same indicator is available on tradingview, tv version RSI length line is red and green, can this be added in mt4 indicator ( https://in.tradingview.com/v/y9b0JI8K/ )
eurusd.jpg
TV.jpg
- These users thanked the author mrtools for the post (total 8):
- srinarayani13, ashdays, Krunal Gajjar, newbie4ever, FredericoA, vvFish, Guna369, Abzak
- Rating: 4.7%
Shalom Shalom! 
Re: Already Converted TradingView Indicators to MT4 Indicators
678Hello mr.tools can you please convert this tradingview indicator to mt4.I bought this indicator script but i think it would be great if i could use this in mt4 too.
Re: Already Converted TradingView Indicators to MT4 Indicators
679Hello, by any chance do you have any more information about this indicator?Poortrader wrote: Sun Dec 21, 2025 9:39 pm Hello mr.tools can you please convert this tradingview indicator to mt4.I bought this indicator script but i think it would be great if i could use this in mt4 too.
Shalom Shalom!
Re: Already Converted TradingView Indicators to MT4 Indicators
680No sorry i don't have i bought the indicator from the creator so i don't know much about it.mrtools wrote: Mon Dec 22, 2025 5:56 am Hello, by any chance do you have any more information about this indicator?