raffus wrote: Tue Nov 04, 2025 3:39 am
@BeatlemaniaSA
hey mate
Based on your experience,
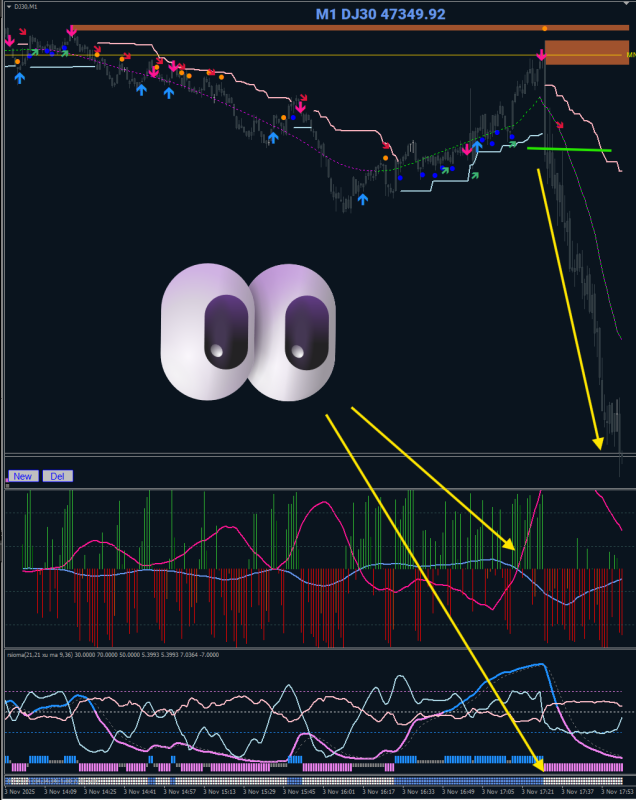
Would you add further trades when the distance between the lines tends to decrease, as indicated by the blue arrow?
I am referring specifically to the two lines inside the circle.
Thanks for all
by hearth
ciao
I cannot see if the blue line represents bullish or bearish. I will assume yes, so because those green strength bars, showing bullish strength, occur in a bullish move, I would not enter any trades. I would ONLY enter after bearish strength bars in a bullish trend.
Checked the original image, and it is a downtrend, which is a bit confusing, having a blue line to represent the second asset in the symbol. Everyone to their own colour scheme. So, yes, I would enter after those 2 green bars but always assessing the trade concerning how many pips it has moved, where these signals are occurring in the price action (Supply and Demand zones), fib levels, and Gann Legacy profit zones.
 Thanks.