Re: XU v48 RSIOMA indicator on Tradingview and ForexTester6
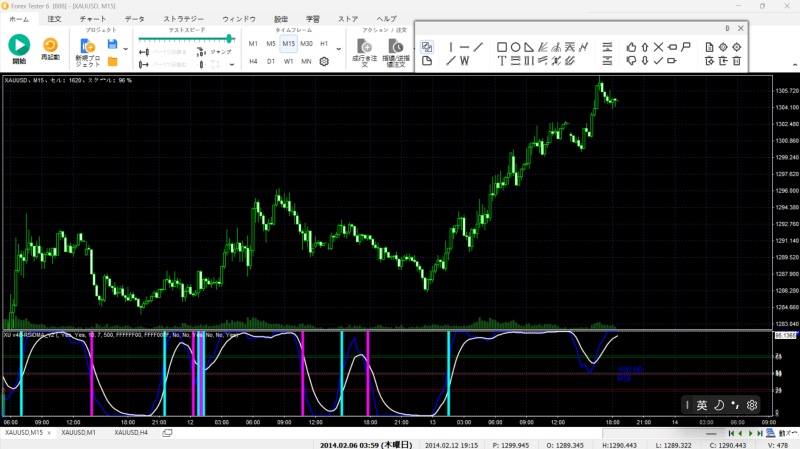
51This is RSIONMA from ForexTester 6, which cost $230 to develop. I paid the developer to make it. I'm giving it away as a Halloween gift.
- These users thanked the author Jedidiah for the post (total 6):
- kudrpenk, forexjoe85, SdW25, Nik123, ashdays, specialkey
- Rating: 3.5%
Do not show pity: life for life, eye for eye, tooth for tooth, hand for hand, and foot for foot.
Deuteronomy 19:21
Deuteronomy 19:21

