Problem with filter will be repainting, because MTF, but you can multiply by 3 like M15 as you are trading M5 and you can do that to whatever timeframe you want, but it does not look so good anymore. I tried that M5 and had M5,M15 and M30, and when all 3 was green, it was so late that...maybe something else for filter.doolfrews wrote: Mon Mar 10, 2025 7:48 pm Your picture reminded me of an experiment I was playing with some time ago. Since I was worried about TMA repainting I used Bollinger bands with chikou and tenkan passing through the bands. I was looking for a filter at that time. Your RSI Cross histo seems to fit well.
Re: Ultimate TDI indicators thread for MT4
842You are right about the MTF "repainting", nevertheless the RSI cross histo is a good guidance on giving you an idea where are you standing, but of course you need a solid confirmation. For example when chikou crosses BB I still wait for a price cross + price under/over tenkan.ROI wrote: Mon Mar 10, 2025 10:10 pm Problem with filter will be repainting, because MTF, but you can multiply by 3 like M15 as you are trading M5 and you can do that to whatever timeframe you want, but it does not look so good anymore. I tried that M5 and had M5,M15 and M30, and when all 3 was green, it was so late that...maybe something else for filter.
Re: Ultimate TDI indicators thread for MT4
843Just in case you think it's all becoming some sordid hoax. I looked back today to find some so you can see what I was trying to say before. In case we are mixing up messages. A stronger question might be "How can I find these things with what I have available?" The pictures rely on the same indicators.ROI wrote: Mon Mar 10, 2025 9:37 pm Does this really happen in real life? Because watched today and it did happen, but after repaint and too long time after.
e. after some thinking, I am 99% sure, that it will never happen, it just cannot. Well, thanks anyway.
I realise now this MA bending into the shoulder is a rise in volatility, that then shifts into a mean reversion that causes the reversal (potential trade move). At least that's one way to describe the price behaviour.
Here's some examples from a quick look today. There are plenty there. It's only one thing that can help to find the right trade opportunity. That's all.
Re: Ultimate TDI indicators thread for MT4
844So glad you brought this up! It does lots of repainting on the chart. As the RSI line wiggles on and off in relation to the other lines. It's what it is.ROI wrote: Mon Mar 10, 2025 10:10 pm Problem with filter will be repainting, because MTF, but you can multiply by 3 like M15 as you are trading M5 and you can do that to whatever timeframe you want, but it does not look so good anymore. I tried that M5 and had M5,M15 and M30, and when all 3 was green, it was so late that...maybe something else for filter.
The idea of RSI is momentum. It's like a train at the train station. When it's stopped, it's stopped. Then when it starts to go to the next station, it slowly, slowly moves, then it picks up speed... and then it's full speed... takes time!
RSI measures speed of price (change). So the smaller timeframes measure small amounts of it. The higher time frame measure larger speeds in relation to their timeframe. It takes more to move the higher timeframe. Think trying to stop a shopping trolley (M5), or trying to stop a bus (H1) by yourself? So you want momentum on your side. Why? There are so many traps out there these days. People with immense pockets and resources are shifting price to stop hunt or shift price out of the areas that look good to enter. Especially in the smaller time frames. But much harder to do in the higher time frames. Because it cost far far more to do it.
So if you have the higher timeframe on your side... you can then anticipate your trade entry....
Re: Ultimate TDI indicators thread for MT4
845Can you post 1 live, not hours after, when it is too late to enter.nomojofomo wrote: Tue Mar 11, 2025 12:39 pm
Here's some examples from a quick look today. There are plenty there. It's only one thing that can help to find the right trade opportunity. That's all.
If you can do that, then I believe you.
Re: Ultimate TDI indicators thread for MT4
846I'm sorry but these setups with repainting TMA are invalid, its an unnecessary waste of time and "hoping game" which leads nowhere. They look good only on history. I would replace the TMA with: Hurst cycles, BB with custom settings, Keltner or Vidia bands. When you play with the settings it workds well. All of them available on this great forum.nomojofomo wrote: Tue Mar 11, 2025 12:39 pm Just in case you think it's all becoming some sordid hoax. I looked back today to find some so you can see what I was trying to say before. In case we are mixing up messages. A stronger question might be "How can I find these things with what I have available?" The pictures rely on the same indicators.
I realise now this MA bending into the shoulder is a rise in volatility, that then shifts into a mean reversion that causes the reversal (potential trade move). At least that's one way to describe the price behaviour.
Here's some examples from a quick look today. There are plenty there. It's only one thing that can help to find the right trade opportunity. That's all.
Vola1.png
Vola2.png
Vola3.png
Vola5.png
Vola6.png
Re: Ultimate TDI indicators thread for MT4
847I'm doing this to show the indicator at work. Which is the tdi indicator histogram. Not the tma and whatever people think it does. Not showing you how I trade either, that's too complicated to write in a single post.ROI wrote: Tue Mar 11, 2025 5:02 pm Can you post 1 live, not hours after, when it is too late to enter.
If you can do that, then I believe you.
The trick is to watch and read the story on the chart, and also anticipate (not predict or project that's a 'belief') what price will do to the indicator before it happens (along with other things of course). That way you have skin in the game. You're not depending and waiting. Active mindset is so important. Please check the following post where I show the other template on another pair.
The main idea of all this is trading the higher time frame inside the lower time frame. Not the other way! If you go the other way you wont have so many satisfying stories.
- These users thanked the author nomojofomo for the post:
- Nik123
- Rating: 0.6%
Re: Ultimate TDI indicators thread for MT4
848Thank you for the indicator, I'll check it out and if it works well together with the tdi I'll share it as a trading suggestion.doolfrews wrote: Tue Mar 11, 2025 7:41 pm I'm sorry but these setups with repainting TMA are invalid, its an unnecessary waste of time and "hoping game" which leads nowhere. They look good only on history. I would replace the TMA with: Hurst cycles, BB with custom settings, Keltner or Vidia bands. When you play with the settings it workds well. All of them available on this great forum.
To reply to you, I don't see any problems with what I showed earlier, as the trade entry happens AFTER the shoulder is formed and price moves beyond the 13ema. So there is no repainting or reshaping of the shoulder by that time. It's over. Below is a real time example so you can see what I mean.
- These users thanked the author nomojofomo for the post:
- doolfrews
- Rating: 0.6%
 Re: Ultimate TDI indicators thread for MT4
849
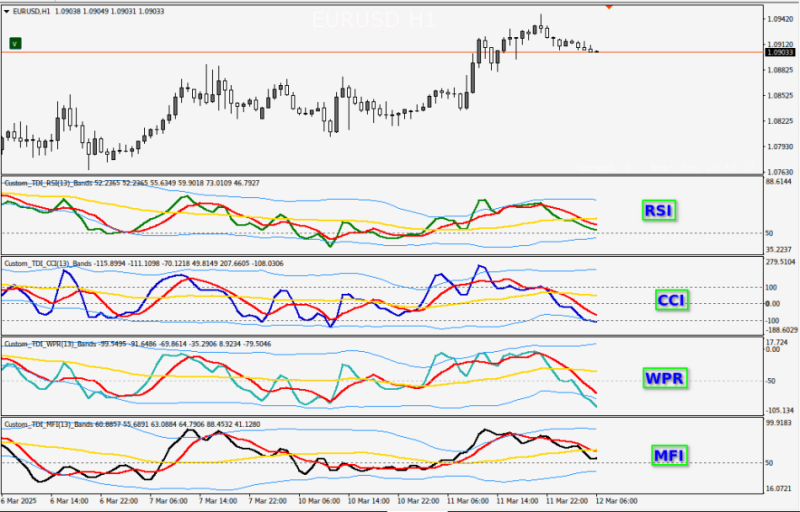
A TDI indicator that uses other oscillators
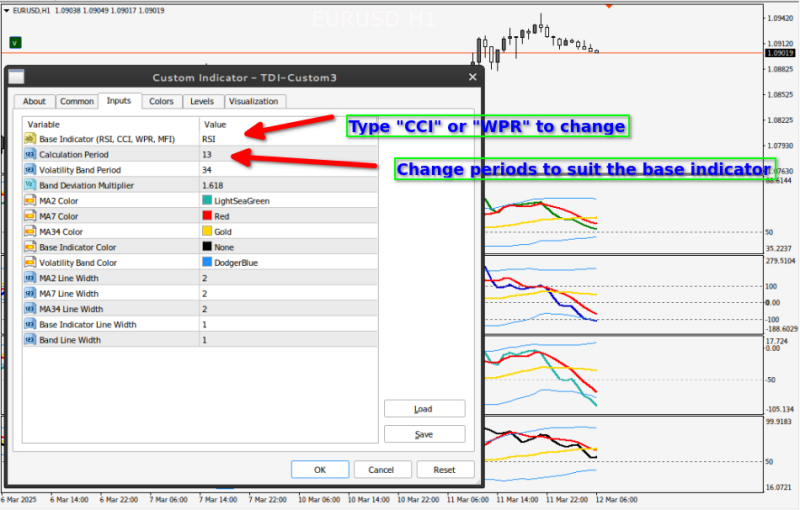
This has probably been done before, but worth sharing. I've put CCI, MFI, WPR as well as RSI as options, and then you can see how well they work.
eg the CCI doesn't have 100 as a limit, it can soar to 200-300 levels, does this offer an advantage in any way? Or the use of larger or smaller periods, like with Woodies cci?
Attached with the indicator is a pdf file about the base indicators (RSI CCI MFI WPR) and how they might be advantageous or not.
Please note how the 'levels' are different and you need to type these in yourself to suit the oscillator. eg, midline is -50 for WPR.
- These users thanked the author nomojofomo for the post (total 7):
- Jimmy, macd & rsi, moey_dw, Akela, Sutatong, Nik123, ujtrader
- Rating: 4.1%
Re: Ultimate TDI indicators thread for MT4
850Really nice TDI indicator my friend. Tops! Had to feature it in today's Daily Downloads

- These users thanked the author Jimmy for the post (total 4):
- macd & rsi, moey_dw, nomojofomo, Nik123
- Rating: 2.4%


