Re: $100 Up Down V6 indicator

732
TransparentTrader wrote: Mon Mar 18, 2024 1:07 am Guner, there are still unanswered questions about these trades.

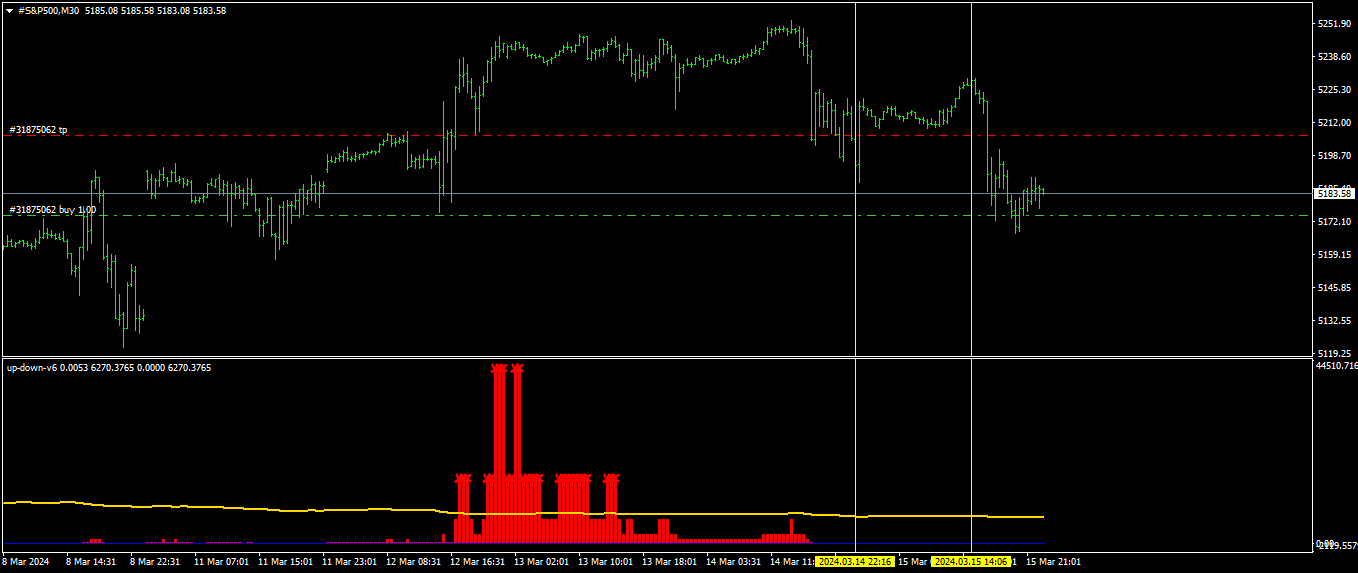
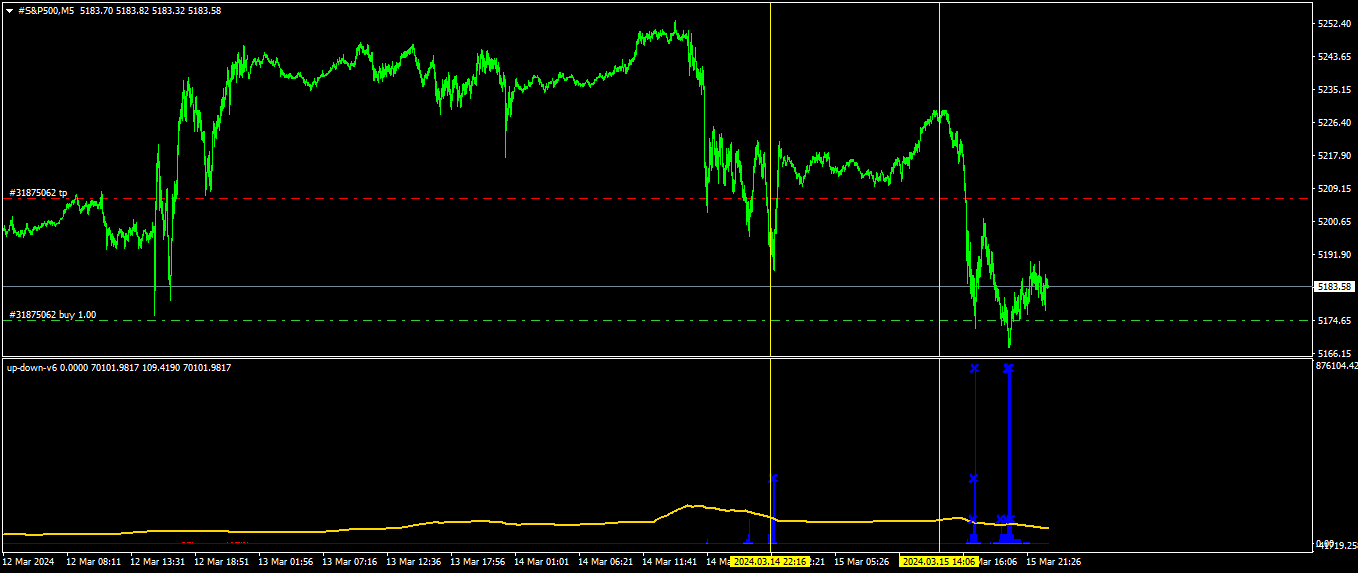
1) Since each buy trade was was 1 lot size with your broker, can you tell us the drawdown you incurred for each individual trade and all 4 trades together when price was at that most recent swing low?

2) What broker are you using to place these demo/live trades?

3) I'm looking at the charts right now and it seems as if the SP500 on the M1 timeframe has yet to hit 5249, let alone breach the 5200 level. How long do you intend to keep holding on these trades, let alone put additional buy trades if you get more signals from Up Down V6/V9 if price continues to keep going down?
Official Forex-station GIF animator at your service 👨‍⚖️
See a GIF with Forex-station.com on it? I probably made it
The best divergence indicator in the world.
Real news exists: Infowars.com 👈

Re: $100 Up Down V6 indicator

733
moey_dw wrote: Mon Mar 18, 2024 1:22 am Pointing-up-this-agree.gif
DEAR TRASPARENTTRADER
only look to the one upper time frame.
where is the trend direction.
if 1h chart go down--5m chart buys make drawdown.only give reaction up.to the 1m chart sell...
much drawdowns gives exit with win.
or stop where to open position.
it is better open position on direction h1 and h4 chart signals.not against them.
if i can do something better then thise..it is been just grail indicator.
if i can do it.i will share again.not make my secret.it is been end of forex.!!
i can not say broker name.it is not right.it is one of Turkish broker.

Re: $100 Up Down V6 indicator

734
guner wrote: Mon Mar 18, 2024 1:27 am DEAR TRASPARENTTRADER
only look to the one upper time frame.
where is the trend direction.
if 1h chart go down--5m chart buys make drawdown.only give reaction up.to the 1m chart sell...
much drawdowns gives exit with win.
or stop where to open posion.
it is better open position on direction h1 and h4 chart signals.not against them.
if i can do something better then thise..it is been just grail indicator.
if i can do it.i will share again.not make my secret.it is been end of forex.!!
i can not say broker name.it is not right.it is one of Turkish broker.
I appreciate the response but this does not completely answer the original questions I am asking.

"if 1h chart go down--5m chart buys make drawdown.only give reaction up.to the 1m chart sell"

I don't quite understand. You're saying if the H1 chart shows a sell signal, you place buys on the M5 chart in anticipation of price going up?

"only look to the one upper time frame."
"it is better open position on direction h1 and h4 chart signals.not against them."


You are saying to use one upper timeframe if I am trading on the M1 or M5 charts, and in your response you say it's better to use H1 and H4 charts. If this is the case, what is the point of even using Up Down V6/V9 on the lower timeframes in the first place?

"much drawdowns gives exit with win.
or stop where to open posion."


Ok, and exactly how much drawdown is reasonable for someone to withstand before it becomes too much? And how many trades should someone open? Do you have a hard limit on this or do you just keep opening trades and incurring more drawdown.

This would be the third time I am asking about the drawdown you incurred on those four SP500 trades, whether in absolute numbers ($) or the total percentage of your live/demo account you are placing at risk.

EDIT: If you are unwilling to share the broker name, can you at least tell us the point value (ex. 5200 -> 5201) in dollar amounts if you trade a single lot on the SP500?


Re: $100 Up Down V6 indicator

736
guner wrote: Mon Mar 18, 2024 1:52 am I don't quite understand. You're saying if the H1 chart shows a sell signal, you place buys on the M5 chart in anticipation of price going up?
be careful to buy.and as soon as you win ,close pos..
or put stop where to open buy pos.wait 1m chart to sell.
Now I'm even more confused.

"As soon as you win" - what does that mean? A fixed number of pips/points or a certain distance away from a recent swing high/low?

"put stop where to open buy pos.wait 1m chart to sell" - does this mean you use a sell signal on the M1 chart to close out a position you initially placed using the H1 timeframe for your analysis?

I think the language barrier between yourself and the rest of the members is disrupting our ability to clearly understand what you are trying to say.

And again, this still leaves my original questions unanswered.

Re: $100 Up Down V6 indicator

740
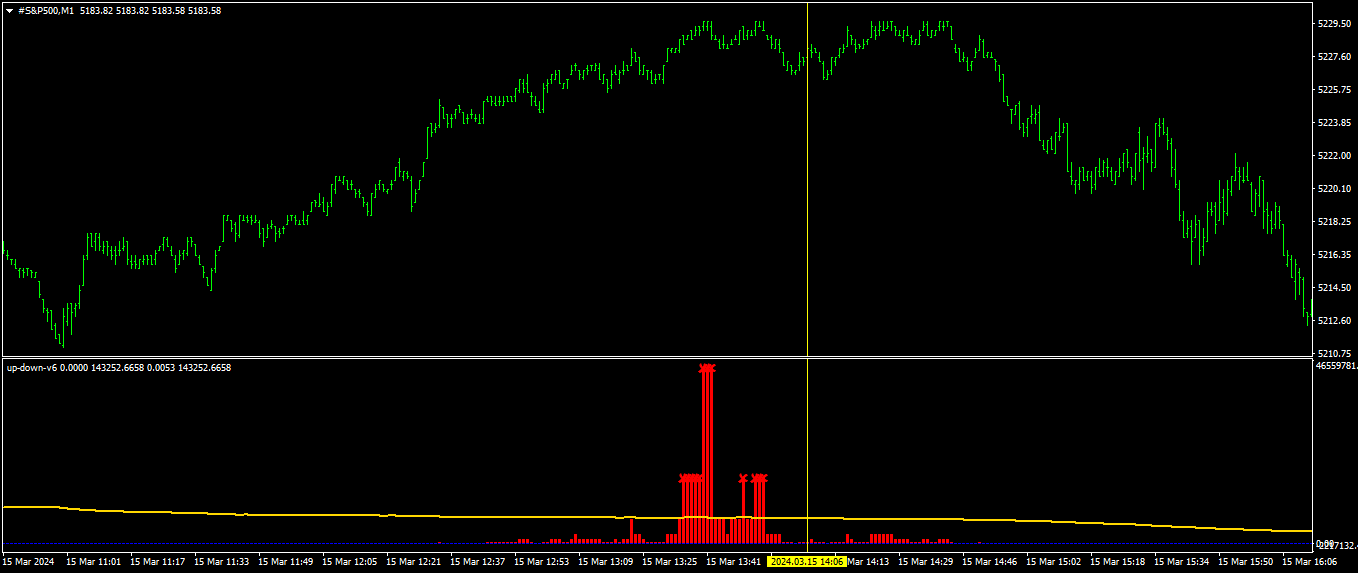
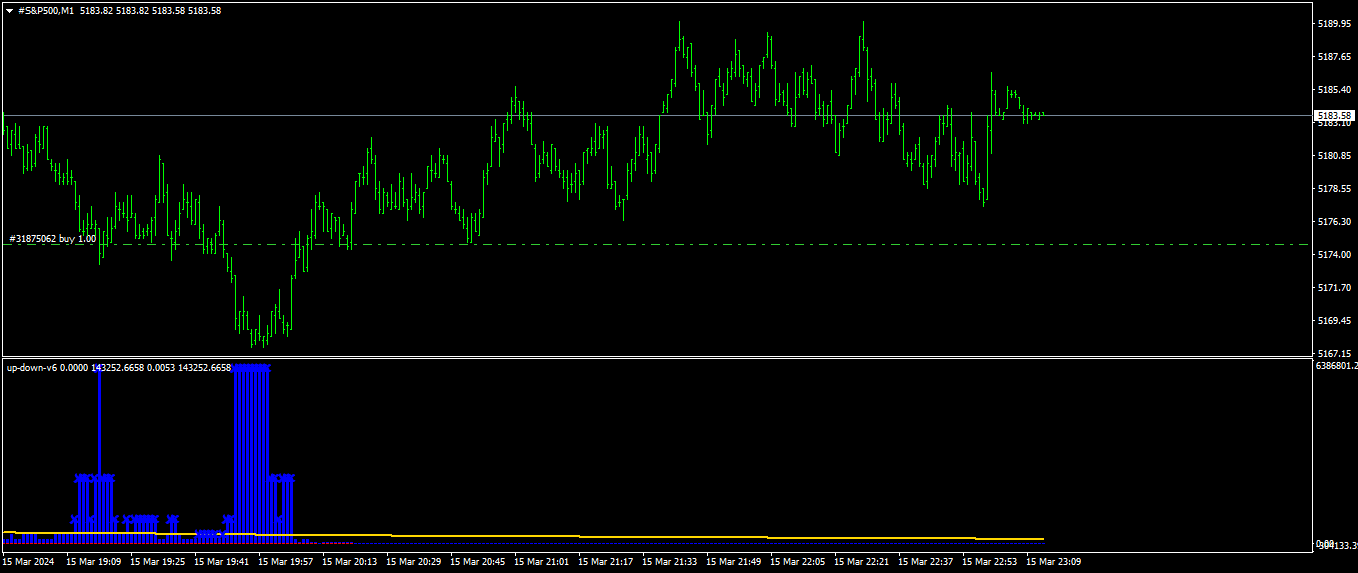
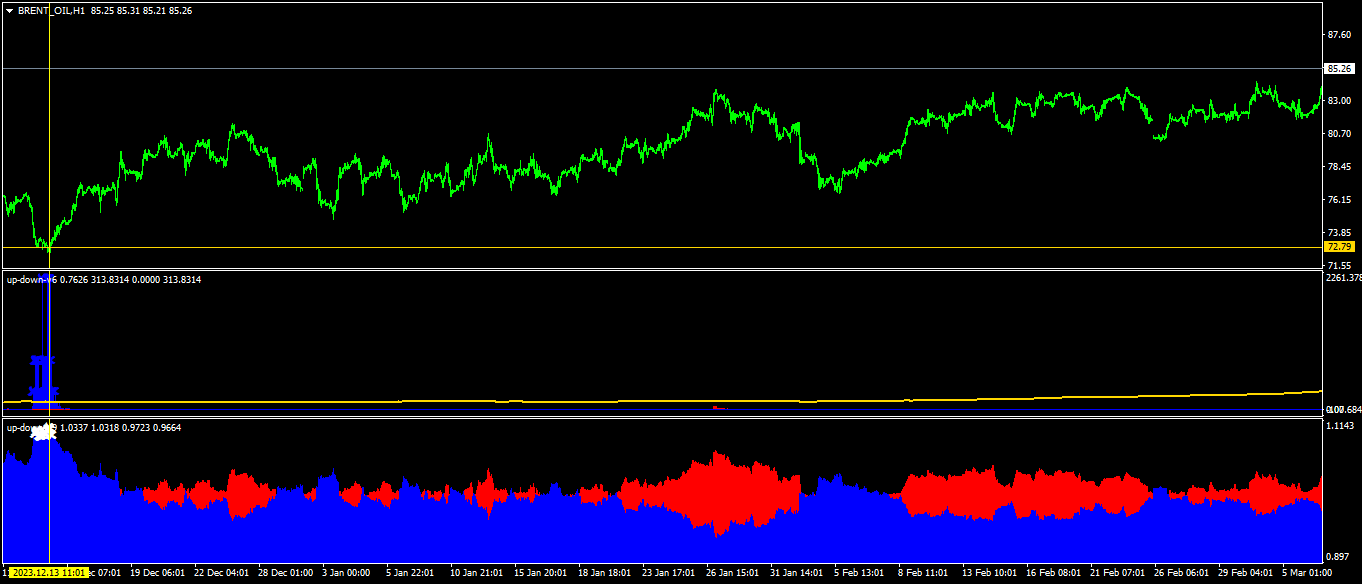
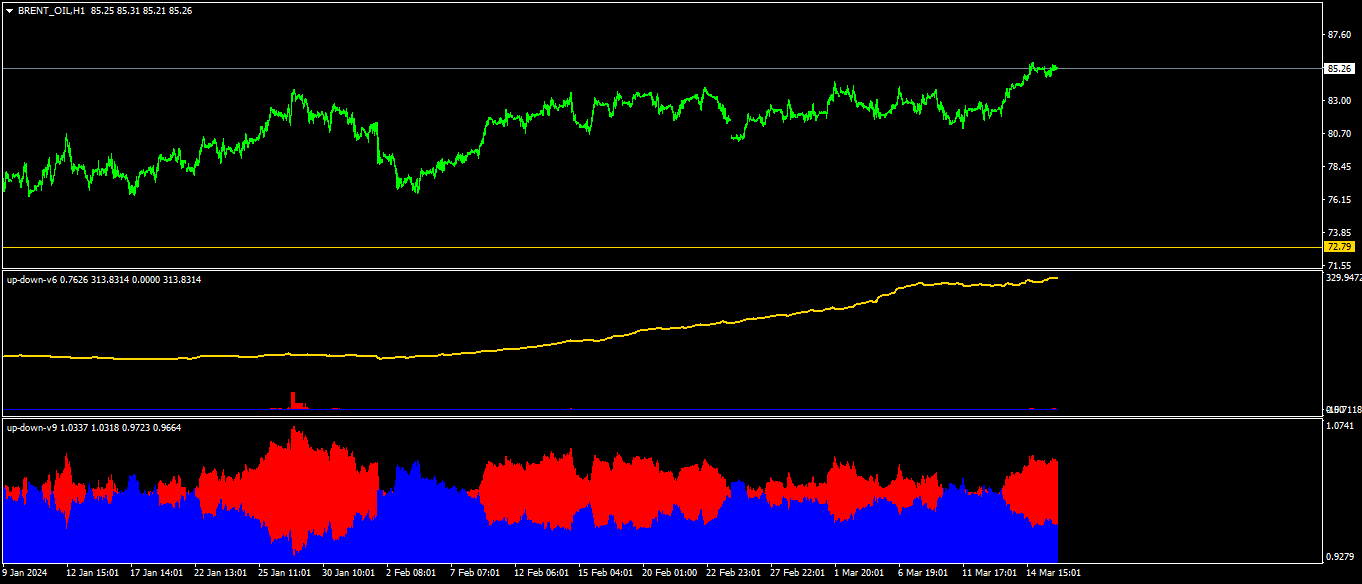
guner wrote: Mon Mar 18, 2024 6:05 am up down v6 is a multi timeframe indicator.it need to look all timeframes

sp 500
30 m sell signal.trend direction down

Image


and 5m chart
on down trend ,open posion buy..
Image


1m chart
end of up correction.

Image


1m chart again.
open up correction buy pos.
5m chart also buy.

Image
guner wrote: Mon Mar 18, 2024 7:59 am transparenttrader
that was above what i am trying to explain you..
on the 30m chart going down market, open 5m chart buy,will reverse 1m chart signals.
Even though your English is broken, I'm going to do my best to translate what you said so everyone else can understand clearly.

Step #1: Look at the trend of the market on the M30 or H1 timeframe. So in our SP500 example, since Up Down V6 had triggered multiple sell signals, we are presumably in a down-trending market.

Step #2: Zoom in to the M5 timeframe and look for buying signals from the Up Down V6 indicator.

Step #3a: Use the appearance of sell signals from Up Down V6 on the M1 timeframe

Step #3b: If you get a buy signal from Up Down V6 on the M1 timeframe that also corresponds with a buy signal on the M5 timeframe, you can open another buy position

Please confirm my translation of your explanation and accompanying pictures is accurate.
These users thanked the author TransparentTrader for the post:
guner


Who is online

Users browsing this forum: No registered users and 6 guests