those are my indicators
up down v6
https://www.mql5.com/tr/market/product/ ... %3aup+down
up down v9
https://www.mql5.com/tr/market/product/ ... %3aup+down
Target Finder
https://www.mql5.com/tr/market/product/ ... %2cup+down
target finder is not work in free demo.because there is a protocol to work it.
i have eplained it on the indicator page on mql5
and it is not a buy sell indicator.
it need other indicators or your expectations ,market news......
most case it give up and down target.
it depend to your selection.or powerfull indicators.
Re: $100 Up Down V6 indicator
576now
euro usd 5m chart
target finder resetted.
let the price is some go up.
when find the calibration point.
then we will find, up target.
exellent signals on v6 and v9 and target finder
euro usd 5m chart
target finder resetted.
let the price is some go up.
when find the calibration point.
then we will find, up target.
exellent signals on v6 and v9 and target finder
Re: $100 Up Down V6 indicator
577euro usd
there is only 1m chart up target..
it looks target finder itself will work buy sell indicator.
there is only 1m chart up target..
it looks target finder itself will work buy sell indicator.
Re: $100 Up Down V6 indicator
578hey guys
i think i found something great indicator
euro usd
1m chart
i think i found something great indicator
euro usd
1m chart
- Rating: 0.6%
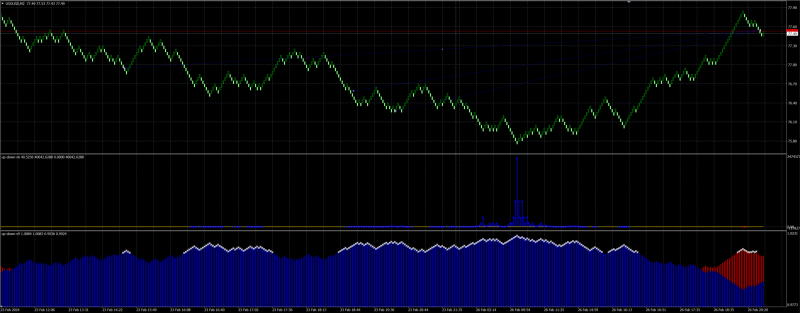
Using Up Down V9 To Trade Oil From February 23-26th
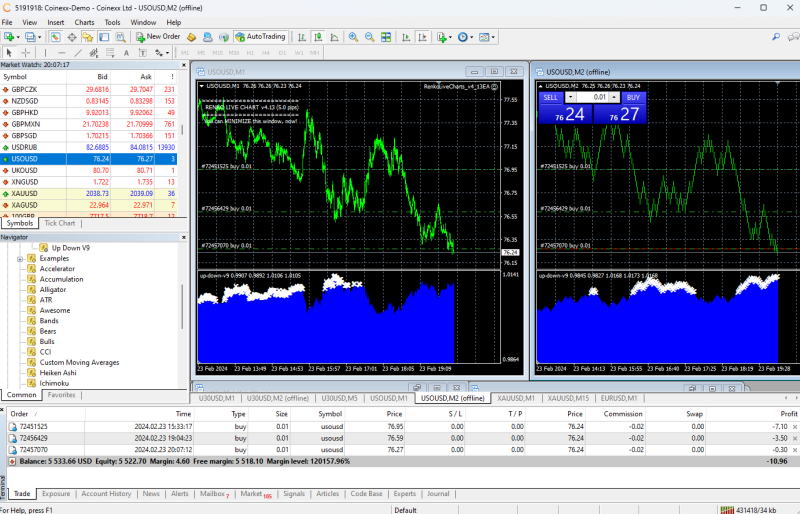
580One of my most recent experiments I didn't get around to posting was using Up Down V9 to trade US/WTI Oil. It's a pretty slow mover but the moves themselves can be quite large in size if you are patient enough.
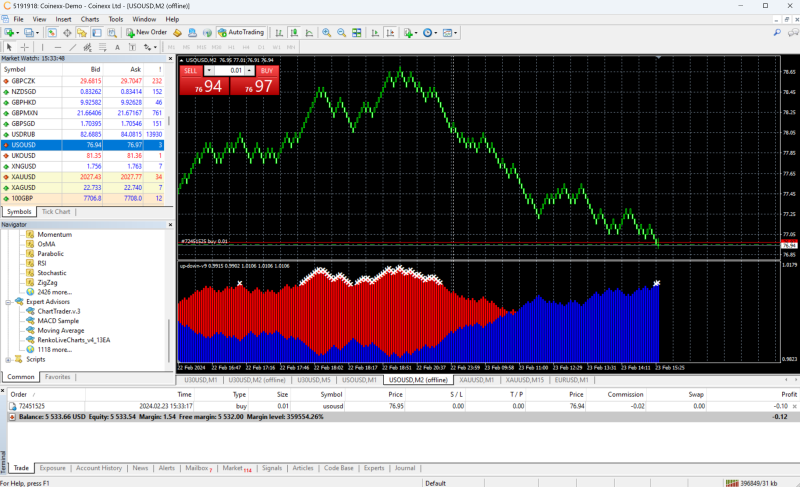
Looked at the Renko chart and saw Up Down V9 start to indicate signs of a bottom forming, so I took a buy trade at around 8:30am EST.
I had to go to the gym from 9am-11:30am EST that same day, so I wasn't around to look at where the trade went.
I came back from my computer, and sure enough I was in the red.
Trade #2
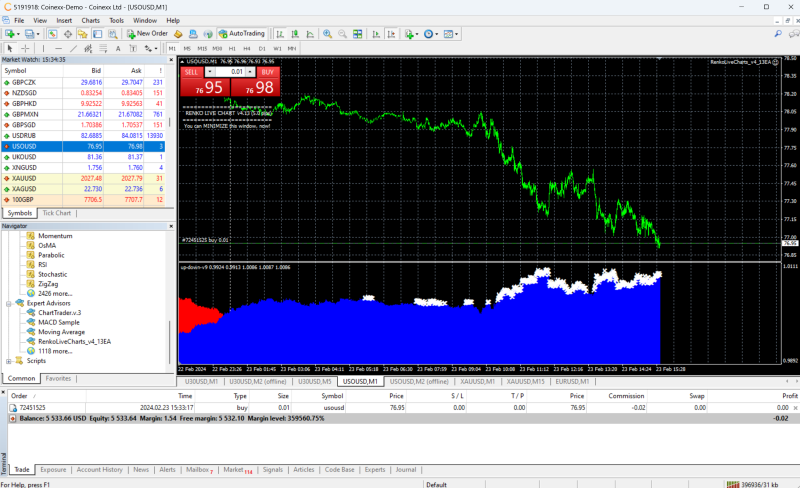
Based on the Up Down V9 indicator showing me another bottom forming, I decided to cost average and enter in a second buy trade at around noon EST.
Trade #3
I'm getting a bit dismayed here but I hold steadfast in my conviction the price of oil will eventually go up. So an hour later at around 1:05pm EST, I put in a third buy trade.
Price action continues to not move anywhere and the trading day ends, so I shut everything down and decide I'll be coming back to my trades on Monday morning.
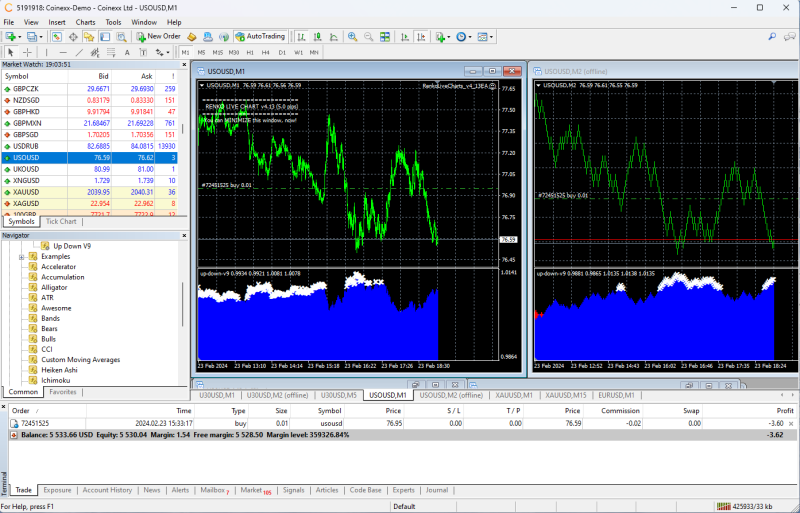
Monday Delivers Some Good News!
As I return to my charts on Monday morning, I start to see the price of oil move in my favor.
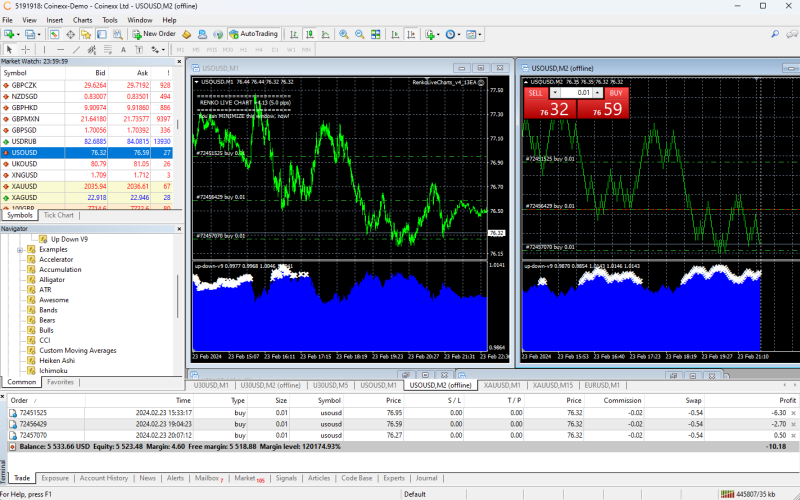
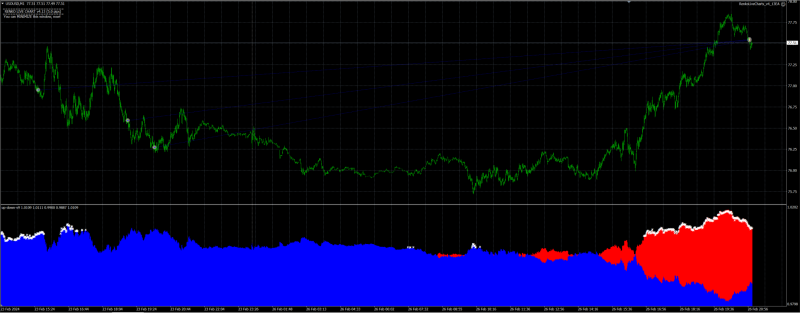
Once I got the X's from the Up Down V9 for a possible top formation on the Renko charts (which happened a lot later than when they formed on the 1-minute candlestick chart), I immediately got out of all three buy trades and closed them in profit just shy of 1pm EST.
Didn't feel like waiting further and hindsight is always 20-20.
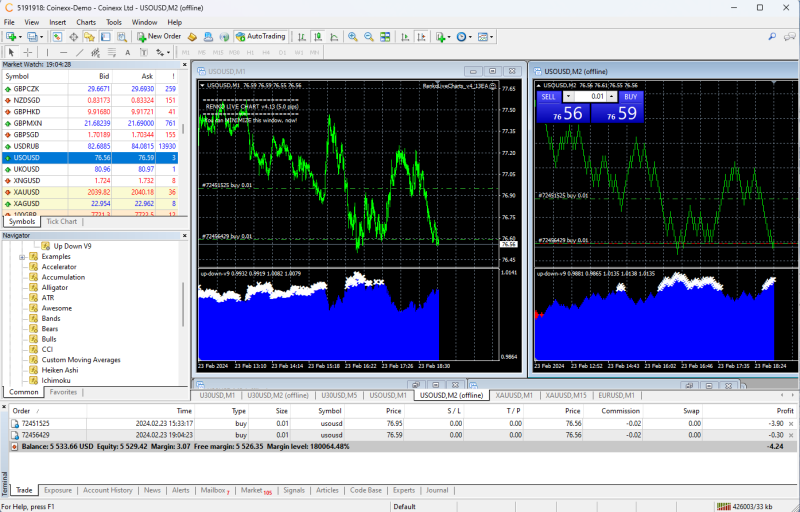
In case you can't see the numbers on the images, here is what I ended up walking away with:
Trade #1 (76.95) = 0.59 dollar win from a 77.54 exit
Trade #2 (76.59) = 0.96 dollar win from a 77.55 exit
Trade #3 (76.27) = 1.27 dollar win from a 77.54 exit
GROSS WIN = 2.82 dollars points (or $28.20 in trading profits)
NET WIN = $28.20 - (3 * $0.02 for commissions) - (3 * $0.54 for overnight buy swap fees) = $28.20 - $0.06 - $1.62 = $26.52
In Closing
Another example of how cost averaging and drawdown management will be extremely crucial if you are using nothing else than the signals given to you by Up Down V9.
Perhaps it's best to use a combination of timeframes, only taking signals when there is agreement on a current timeframe and a higher timeframe (ex. 1-minute and 5-minute).
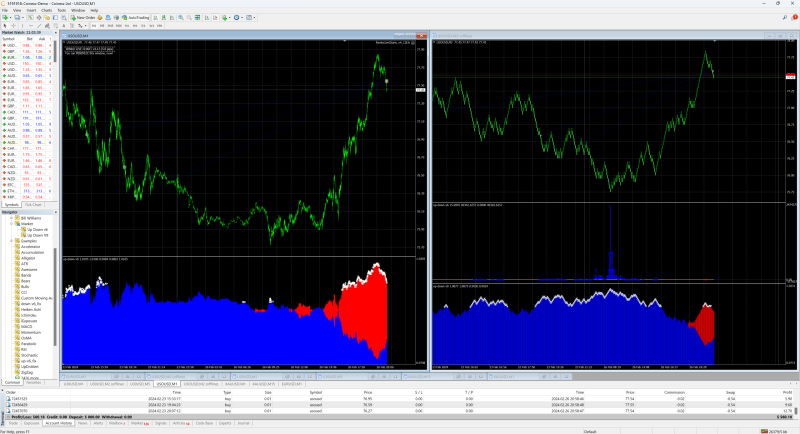
But then there's also the question of which charts I use. The Renko charts and candlestick charts sometimes alternate between which ones give the slower or faster signals pertaining to top/bottom formation.
Lots more experimentation for me to do. So far I'm liking the potential of Up Down V9.
Now it's a question of what I will test Up Down V6 on and when I will do it. Hopefully I won't find too many glitches, and ideally it will work equally well on Renko charts and candlestick charts!
- Broker: Coinexx
- Timeframe:1 minute (candlestick) and 5-cent Renko boxes (i.e. $70.00 -> $70.05 is one box)
- Instrument: US Oil (USOUSD)
- Trade size: 0.01 lot per trade, the lowest Coinexx allows me to go, translating to $0.10 in profit per cent moved (i.e. $70.00 -> $70.01 on the oil chart = $0.10 in profit on a buy trade)
- Commission: $0.02 per trade
- Overnight buy swap fees: $0.54 per trade
- Account: Demo
Looked at the Renko chart and saw Up Down V9 start to indicate signs of a bottom forming, so I took a buy trade at around 8:30am EST.
I had to go to the gym from 9am-11:30am EST that same day, so I wasn't around to look at where the trade went.
I came back from my computer, and sure enough I was in the red.
Trade #2
Based on the Up Down V9 indicator showing me another bottom forming, I decided to cost average and enter in a second buy trade at around noon EST.
Trade #3
I'm getting a bit dismayed here but I hold steadfast in my conviction the price of oil will eventually go up. So an hour later at around 1:05pm EST, I put in a third buy trade.
Price action continues to not move anywhere and the trading day ends, so I shut everything down and decide I'll be coming back to my trades on Monday morning.
Monday Delivers Some Good News!
As I return to my charts on Monday morning, I start to see the price of oil move in my favor.
Once I got the X's from the Up Down V9 for a possible top formation on the Renko charts (which happened a lot later than when they formed on the 1-minute candlestick chart), I immediately got out of all three buy trades and closed them in profit just shy of 1pm EST.
Didn't feel like waiting further and hindsight is always 20-20.
In case you can't see the numbers on the images, here is what I ended up walking away with:
Trade #1 (76.95) = 0.59 dollar win from a 77.54 exit
Trade #2 (76.59) = 0.96 dollar win from a 77.55 exit
Trade #3 (76.27) = 1.27 dollar win from a 77.54 exit
GROSS WIN = 2.82 dollars points (or $28.20 in trading profits)
NET WIN = $28.20 - (3 * $0.02 for commissions) - (3 * $0.54 for overnight buy swap fees) = $28.20 - $0.06 - $1.62 = $26.52
In Closing
Another example of how cost averaging and drawdown management will be extremely crucial if you are using nothing else than the signals given to you by Up Down V9.
Perhaps it's best to use a combination of timeframes, only taking signals when there is agreement on a current timeframe and a higher timeframe (ex. 1-minute and 5-minute).
But then there's also the question of which charts I use. The Renko charts and candlestick charts sometimes alternate between which ones give the slower or faster signals pertaining to top/bottom formation.
Lots more experimentation for me to do. So far I'm liking the potential of Up Down V9.
Now it's a question of what I will test Up Down V6 on and when I will do it. Hopefully I won't find too many glitches, and ideally it will work equally well on Renko charts and candlestick charts!
- These users thanked the author TransparentTrader for the post (total 2):
- FastForex, shinnosuke
- Rating: 1.2%

