One is 15m chart
Other is 1h chart.
Ewerything must be different.
Not weird.
 Re: $100 Up Down V6 indicator
496
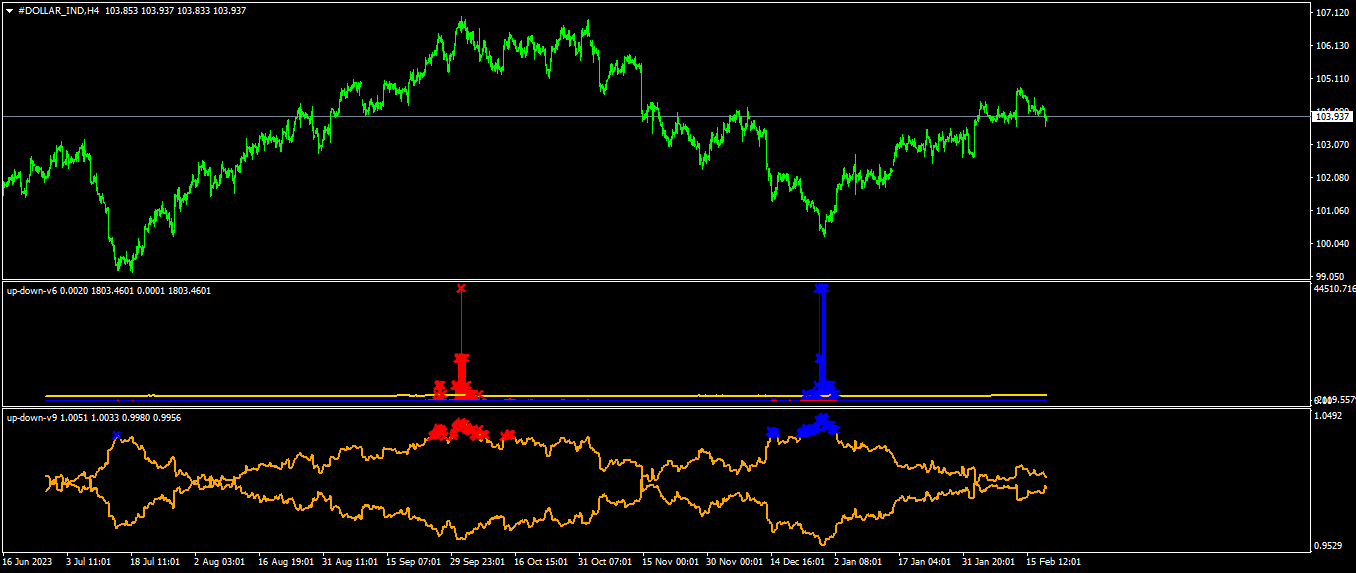
Although I'm more interested in higher timeframes, I have been testing the V6 and v9 indicator today on 5m EUR/USD.
The indicator did not repaint during the hours that I was watching. The v9 indicator gives more and more frequent signals than the v6.
Problem with both is that -although they are quite accurate in identifying tops and bottoms- they sometimes give very early signals so if you would trade these signals as stand alone and jump in at the first signal, you often will get in (too) early and risk major drawdown... unless you have balls of steel, no one likes heavy drawdown and the risk of being stopped out before it goes into the direction you want it to go.
I think this indicator can be very useful, especially the v6 and on higher timframes, and you probably should combine it with other indicator(s) that keep you out of (too) early entries. In this example, I added the XA ma indicator from Xard but I'm sure there are more and maybe better indicators to do the job.
So far my first and short experience with this up and down indicators. I will test them on higher timeframes but that will take time because it can take weeks ore months for the signals to appear on 4h or daily timeframe.
Please share your experiences and let's help each in the search for our 'holy grail' :-)
- These users thanked the author FastForex for the post (total 2):
- TransparentTrader, shinnosuke
- Rating: 1.2%
My First Day Demo Trading Up Down V9
500Here is an update on my very first day entering and exiting a trade using nothing more than the Up Down V9 indicator signals.
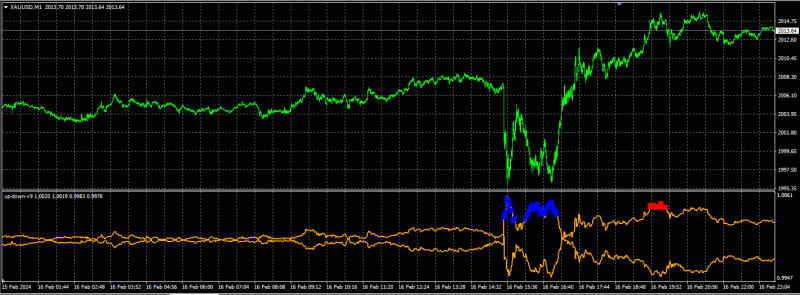
I saw this on February 16th when the market opened at 9:30am EST and just looked at the indicator. No repainting happened, as you can see from my previous post first announcing I had bought Up Down V9.
Gold had a few buy signals given off by Up Down V9, and you would have gotten in anywhere from $1,997-$1,999 depending on whether you were at your computer when the signals were given off. And whether you would determine to take one or more buy trades on the basis of numerous blue X's appearing.
Around 1pm EST is when the few red X's (sell signals) appeared and you would have gotten out around $2,012-2,014. Again, depends on whether you were at your computer and whether you decide to get out at the first or last red X.
So depending on your precise entry and exit, you would have been looking at a potential $13-17 winner for one trade. You can add on any multiplier to that depending on how many trades you took in the blue regions and whether you held on to them all the way until the next red X.
Trade #1
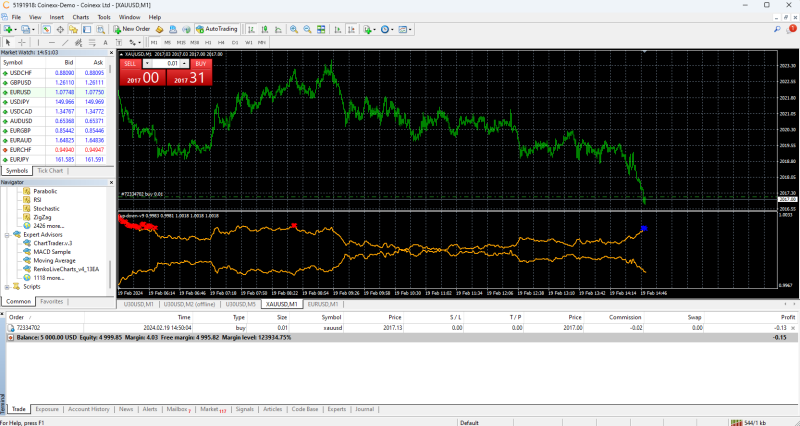
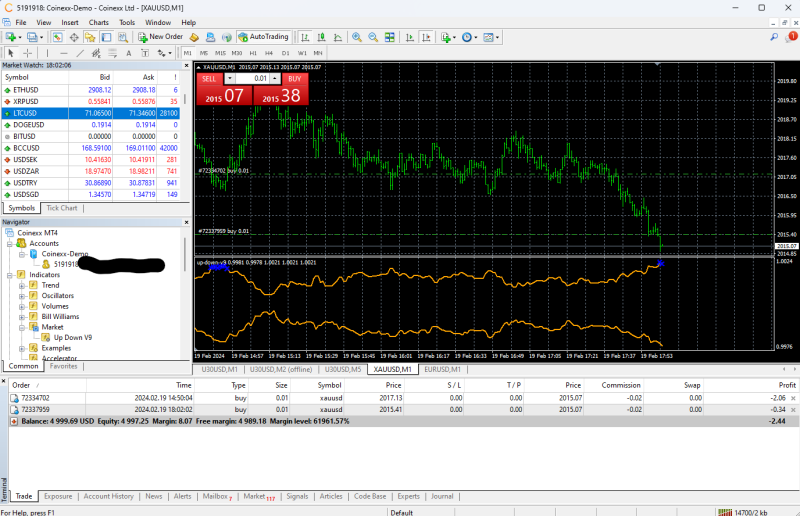
February 19th at around 7:50am EST is when I was looking at the 1-minute chart on Gold and saw the very first buy signal from Up Down V9.
I took it using the smallest available lot size of 0.01, which translates to roughly $0.01 in profit per cent (i.e. $2,000.00 -> $2,000.01). Coinexx takes $0.02 commission for a 0.01 lot size on Gold and charges $0.16 for an overnight buy swap.
I would have wanted a better entry, but it was "late" because the spread was 35-40 cents wide between the bid and the ask lines. Plus it was the holidays, although I don't know if the spread on Gold in Coinexx is normally that large.
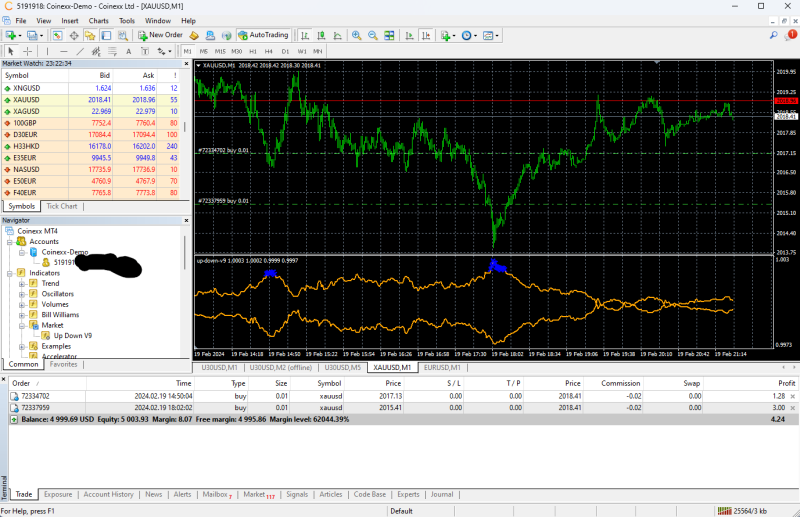
Trade #2
I placed a second 0.01 lot size buy trade around 11am EST on the same day. Notice how my entry for this second trade was "late" due to the wide spread on Gold.
Also, pay attention to how I was in drawdown for the first buy trade. This will be a very common situation you will encounter when using this indicator. It is up to you to decide whether you want to keep cost averaging into a trade, or setting a hard stop loss so you can manage your risk and try again when a new buy/sell signal appears.
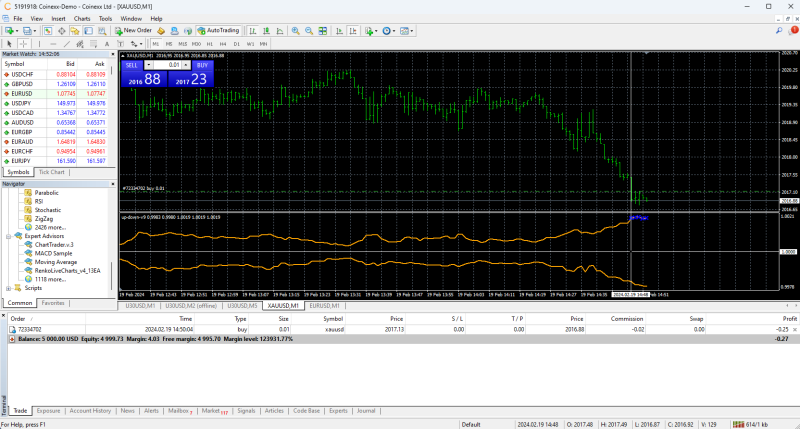
Holding On To Both Trades
As you can see, price action eventually swung in my favor and I ended the day in profit. With this being said, I wanted to wait until I get a sell signal (red X) from Up Down V9 for me to exit both trades.
Unless price action is extremely volatile on the particular instrument and/or timeframe you're trading, expect to spend a lot of time sitting on your hands and waiting until the next valid buy/sell signal appears. Even on the lower timeframes.
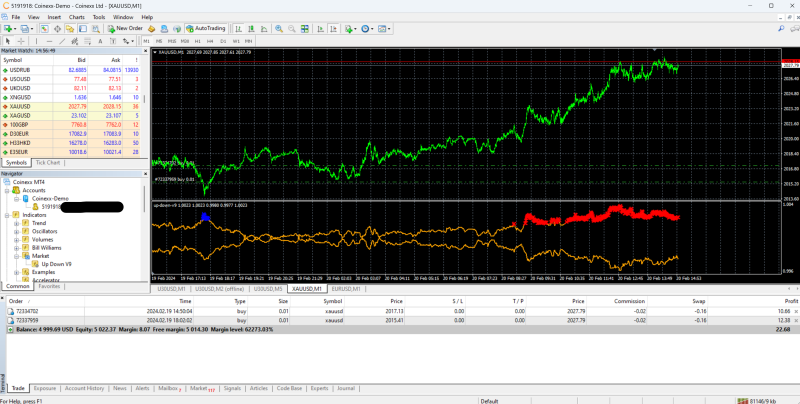
This is February 20th just shy of 8am EST, and the result of me holding both trades overnight while incurring the buy swap fee of $0.16 per 0.01 trade I placed.
Now would be a good time to discuss the major weakness of Up Down V9:
It's a very good thing I wasn't at my computer until later in the morning, otherwise one of two things could have happened. The first is I would have exited both buy trades at the initial red X (around 2am EST) and missed out on even more profits.
The second thing, and even worse, is I would have kept on taking numerous sell trades based on the very long streak of red X's you can see in the picture above. I would have had to endure a very heavy drawdown on my account and hope price would eventually go down.
In other words, when there is a massive trend to the upside or downside with no signs of stopping anytime soon, Up Down V9 will give you an endless barrage of signals. A classic nightmare situation for people who like trading markets when they are ranging (a.k.a. mean reversion).
And it's not just me either, as FastForex had the same insights when he was testing out both V6 and V9.
This is evident even on the higher timeframe charts of Gold that guner himself has shared.
I know guner is currently working on a new version of Up Down V9 that will help address this common situation. I'm eagerly anticipating this release as I suspect this common situation won't happen as often.
It also reflects what guner has previously said about Up Down V6 compared to Up Down V9: While V9 is better suited for "short" cycles (which is anywhere between 1-minute and 30-minutes, V6 is better suited for "long" cycles. Although he claims he doesn't "offer" V9 and says V6 is the better indicator,
Perhaps it's not the case that one is universally better than the other, but that one is only "better" within a specific context.
Additionally, looking at these two older examples here and here, and the relatively newer examples here and here, I'm wondering if a strategy can be made where V6 and V9 can be combined to provide the strongest signals possible (i.e. you only take buy/sell trades on a given timeframe when both indicators are in agreement with one another).
Exiting Both Trades
Back to the trades themselves, I saw where price action was and I decided to take an exit. Since it was my very first time using Up Down V9 I didn't want to prematurely get into a sell trade and give back the money I made.
Suggestions For V6/V9 Improvements
I do hope guner takes these comments to heart as I am not the only person in the thread to have provided the feedback below.
When that trade goes successfully or unsuccessfully, I will put the results in this thread.
Any questions, comments, feedback, please let me know. I am an open book as someone who has actually invested money and bought Up Down V9 to personally test out for myself.
PS - Pucmola, we're still waiting for you to release your genius work so we can finally do the head-to-head comparison!
- Broker: Coinexx
- Timeframe: 1 minute
- Instrument: Gold (XAUUSD)
- Account: Demo
I saw this on February 16th when the market opened at 9:30am EST and just looked at the indicator. No repainting happened, as you can see from my previous post first announcing I had bought Up Down V9.
Gold had a few buy signals given off by Up Down V9, and you would have gotten in anywhere from $1,997-$1,999 depending on whether you were at your computer when the signals were given off. And whether you would determine to take one or more buy trades on the basis of numerous blue X's appearing.
Around 1pm EST is when the few red X's (sell signals) appeared and you would have gotten out around $2,012-2,014. Again, depends on whether you were at your computer and whether you decide to get out at the first or last red X.
So depending on your precise entry and exit, you would have been looking at a potential $13-17 winner for one trade. You can add on any multiplier to that depending on how many trades you took in the blue regions and whether you held on to them all the way until the next red X.
Trade #1
February 19th at around 7:50am EST is when I was looking at the 1-minute chart on Gold and saw the very first buy signal from Up Down V9.
I took it using the smallest available lot size of 0.01, which translates to roughly $0.01 in profit per cent (i.e. $2,000.00 -> $2,000.01). Coinexx takes $0.02 commission for a 0.01 lot size on Gold and charges $0.16 for an overnight buy swap.
I would have wanted a better entry, but it was "late" because the spread was 35-40 cents wide between the bid and the ask lines. Plus it was the holidays, although I don't know if the spread on Gold in Coinexx is normally that large.
Trade #2
I placed a second 0.01 lot size buy trade around 11am EST on the same day. Notice how my entry for this second trade was "late" due to the wide spread on Gold.
Also, pay attention to how I was in drawdown for the first buy trade. This will be a very common situation you will encounter when using this indicator. It is up to you to decide whether you want to keep cost averaging into a trade, or setting a hard stop loss so you can manage your risk and try again when a new buy/sell signal appears.
Holding On To Both Trades
As you can see, price action eventually swung in my favor and I ended the day in profit. With this being said, I wanted to wait until I get a sell signal (red X) from Up Down V9 for me to exit both trades.
Unless price action is extremely volatile on the particular instrument and/or timeframe you're trading, expect to spend a lot of time sitting on your hands and waiting until the next valid buy/sell signal appears. Even on the lower timeframes.
This is February 20th just shy of 8am EST, and the result of me holding both trades overnight while incurring the buy swap fee of $0.16 per 0.01 trade I placed.
Now would be a good time to discuss the major weakness of Up Down V9:
It's a very good thing I wasn't at my computer until later in the morning, otherwise one of two things could have happened. The first is I would have exited both buy trades at the initial red X (around 2am EST) and missed out on even more profits.
The second thing, and even worse, is I would have kept on taking numerous sell trades based on the very long streak of red X's you can see in the picture above. I would have had to endure a very heavy drawdown on my account and hope price would eventually go down.
In other words, when there is a massive trend to the upside or downside with no signs of stopping anytime soon, Up Down V9 will give you an endless barrage of signals. A classic nightmare situation for people who like trading markets when they are ranging (a.k.a. mean reversion).
And it's not just me either, as FastForex had the same insights when he was testing out both V6 and V9.
This is evident even on the higher timeframe charts of Gold that guner himself has shared.
I know guner is currently working on a new version of Up Down V9 that will help address this common situation. I'm eagerly anticipating this release as I suspect this common situation won't happen as often.
It also reflects what guner has previously said about Up Down V6 compared to Up Down V9: While V9 is better suited for "short" cycles (which is anywhere between 1-minute and 30-minutes, V6 is better suited for "long" cycles. Although he claims he doesn't "offer" V9 and says V6 is the better indicator,
Perhaps it's not the case that one is universally better than the other, but that one is only "better" within a specific context.
Additionally, looking at these two older examples here and here, and the relatively newer examples here and here, I'm wondering if a strategy can be made where V6 and V9 can be combined to provide the strongest signals possible (i.e. you only take buy/sell trades on a given timeframe when both indicators are in agreement with one another).
Exiting Both Trades
Back to the trades themselves, I saw where price action was and I decided to take an exit. Since it was my very first time using Up Down V9 I didn't want to prematurely get into a sell trade and give back the money I made.
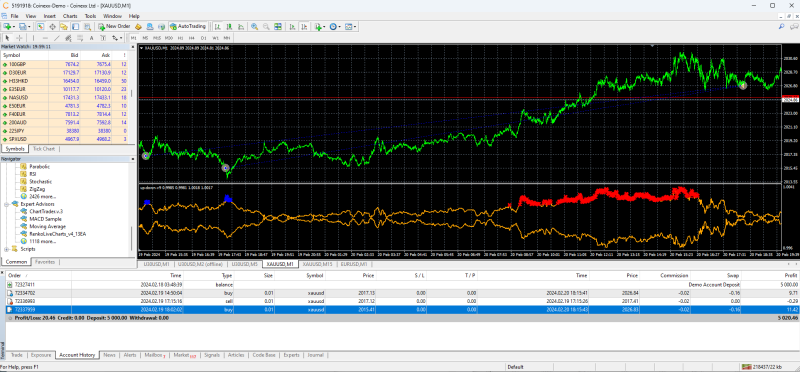
- So in total, between the two 0.01 lot size buy trades I made on Gold in the 1-minute timeframe, my total profit was $21.13.
- Subtracting $0.04 for commissions charged to both trades and $0.32 for overnight buy swap fees charged to both trades, my net profit was $20.77.
- Ignore the sell trade in the middle as that was an accidental mis-click I made while resizing the MT4 window.
Suggestions For V6/V9 Improvements
I do hope guner takes these comments to heart as I am not the only person in the thread to have provided the feedback below.
- Add email/audio/push alerts to the indicator so we can be notified when a red/blue X appears, especially given how infrequently they appear even on V9. Most of us here work full-time day jobs and can't have our eyes glued to the charts all day long, hence why adding alerts will be very helpful in getting the right entries with the right timing. Especially if you are trading multiple instruments, as I already mentioned here.
- Fix the glitch where the indicator "disappears" in the subwindow upon switching to a new timeframe, causing you to re-enter the indicator's settings to enter in the "Processed" number of bars just to make it appear again.
- Fix the glitch where the indicator appears to suddenly go "flat" if you scroll back far enough, as seen in this video I created
- Release the TradingView versions of Up Down V9, Up Down V6 and the upcoming Target Finder for either trial or purchase.
- Create a dashboard that allows you to see whether the indicator is flashing nothing, a red X or a blue X across multiple timeframes. This same dashboard would also allow you to pick and choose which instruments you want to monitor. Here is a basic example of what this would look like, and the entire thread is filled with dashboards and their mq4 source code. The way I see it, 75% of the work is already done for guner to create a V6/V9 dashboard and I've already brought up this suggestion before.
- This is a purely cosmetic request, but I was wondering if the default Up Down V9 indicator can have the colors of the lines be red and blue like they are here. Having both lines be orange by default can be visually confusing as it's not immediately apparent if price action is moving towards/away from a top/bottom.
When that trade goes successfully or unsuccessfully, I will put the results in this thread.
Any questions, comments, feedback, please let me know. I am an open book as someone who has actually invested money and bought Up Down V9 to personally test out for myself.
PS - Pucmola, we're still waiting for you to release your genius work so we can finally do the head-to-head comparison!
- These users thanked the author TransparentTrader for the post (total 5):
- BeatlemaniaSA, guner, wojtek, shinnosuke, Starfish
- Rating: 2.9%