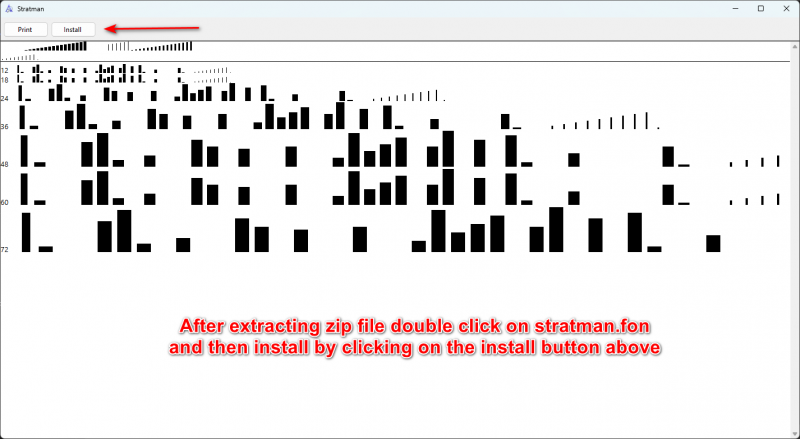
Woodyz wrote: Sun Sep 24, 2023 8:10 am
Are you using the ADX to spot divergences now? If so, how do you compare it to the RSI?
--- Yes
I got rid of the ADX and just used the RSI myself because I like to gauge things relative to the levels.
Now when judging the HTF charts for your directional bias, what have you found to be the best way to do so that gives
you an edge?
Using the Mini charts & going with the candle colour.
----- A combination of ALL that you have mentioned here and below
By looking at your HTF's and seeing where the price is relative to the ATS major expansion levels, or do you have a specific technique/process you use that gives you an edge above the rest?
This I believe to be one of the most important things to get right.
Guys,
It does NOT matter whether you have the ADX, RSI, CCI, TDI, Bollinger bands, MACD, MA's, Trendlines, Support and Resistance, Supply and Demand or any other combination of indicators on your chart. They are simply mathematical visual representations of Price Action. I am a visual person so I prefer indicators to highlight what is happening with Price Action.
Other traders prefer nothing on their charts. It really is a personal thing. However, notwithstanding this view
THE MOST IMPORTANT edge that you can have and develop over the masses of traders that fail in trading is...
PATIENCE
Without
PATIENCE to wait for the right setup and opportunity to take the trade...
YOU WILL FAIL!
This is what I have learned the hard way but learn it I have! I cannot teach you
PATIENCE you have to develop it
YOURSELF.
So go onto your charts and
1) Look to see what Price Action is doing, (try and determine a directional bias)
2) Determine what would be the right combination (of indicator confluence) or moment to wait for,
3) Wait
PATIENTLY for that opportunity to arrive and then,
4) Pull the trigger on your trade
Warmest regards,
BeatlemaniaSA