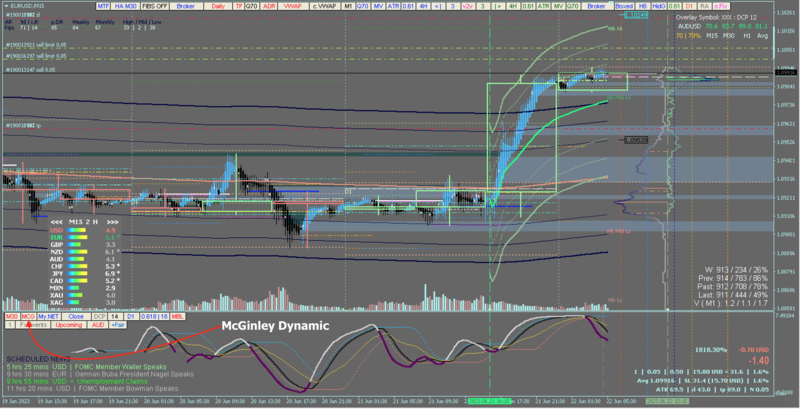
dynamic MyNET =► McGinley Dynamic
The McGinley Dynamic indicator is a type of moving average that was designed to track the market better than existing moving average indicators. It is a technical indicator that improves upon moving average lines by adjusting for shifts in market speed. John R. McGinley, a market technician, is the inventor of the eponymous indicator.
KEY TAKEAWAYS
The McGinley Dynamic indicator is a type of moving average that was designed to track the market better than existing moving average indicators.
This indicator solves the issue of varying market speeds by incorporating an automatic adjustment factor into its formula, which speeds (or slows) the indicator in trending, or ranging, markets.
The McGinley Dynamic indicator improves upon conventional moving averages by minimizing price separations and volatile whipsaws so that price action is more accurately reflected.
Understanding McGinley Dynamic Indicator
The McGinley Dynamic indicator attempts to solve a problem inherent in moving averages that use fixed time lengths. The basic problem is that the market, being the great discounting mechanism that it is, reacts to events at a speed that a moving average will not be able to cope with.
This issue is called the lag, and there is no type of moving average, whether it be simple (SMA), exponential (EMA), or weighted (LWMA), that is not affected by this. Understandably, this will call into question the reliability of that moving average. The McGinley Dynamic indicator takes into account speed changes in a market (hence, "dynamic") to show a smoother, more responsive, moving average line.
The speed of the market is not consistent; it frequently speeds up and slows down. Traditional moving averages, such as a simple moving average or an exponential moving average, fail to account for this market characteristic. The McGinley Dynamic indicator solves this problem by incorporating an automatic smoothing factor into its formula to adjust to market moves. This speeds, or slows, the indicator in trending, or ranging, markets.
This is not to say that the aforementioned issue of lag has been eradicated, only that the reaction to market movement is faster. The key point to note is that, due to its smoothing constant, it will be more market reactive than other moving averages. The user can customize this indicator through the selection of the number of periods.
Source: Investopedia dot com
• New templates ( a must )
• You can download and read more about the system by clicking »»
HERE
Since Frank Sinatra sings in his own way, my charts sing... ♪ I did it, My... Way... ♬ ; )─