QEMA percentage indicator - Quadruple Exponential Moving Average
QEMA is the Quadruple Exponential Moving Average. With this small change you can modify the percentage of the quadruple correction respect to the normal EMA.
 Re: Something interesting please post here (Metatrader)
142
Shin Ne Ashi Candles - The improved Heiken Ashi 
The Shin Ne Ashi candlesticks are based on the closing price, and when the price rises above the previous high price in the rising market price, in the falling market it will fill in the new feet when it falls below the previous low price.
Therefore, when you update the high value in the upward phase, the positive line is entered, and when you update the low price at the descent price, the negative line will be filled in.
New value legs have non-time series new value feet and time series new value feet. In the case of non-time series new value feet, feet are not displayed unless there is a high price or low price update, but time series new price feet In the case of, it has the feature of changing the foot width or continuing to display by drawing the same foot until updating.
In the figure 1, the number of feet increases over time (even without updating the price), so it will be a time series new value feet.
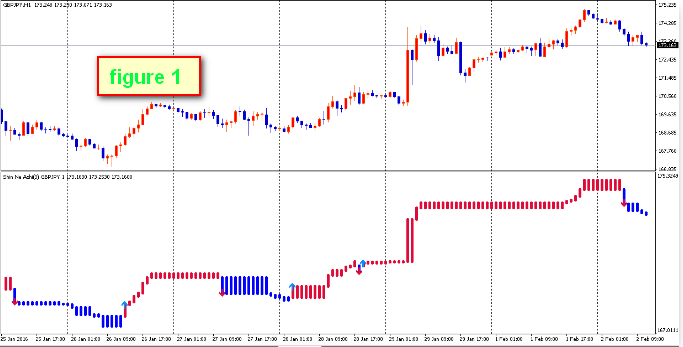
There are various kinds of new value feet, but "commonly used three times" is commonly used in general. In the medium and long term, "new value five legs" "new value 10 legs" may be used.
New value Three legs do not add foot until the high value of the most recent three positive lines or the low value of the hidden line is updated , and lower the possibility of becoming a damascene to surely capture the turning point It is aiming.
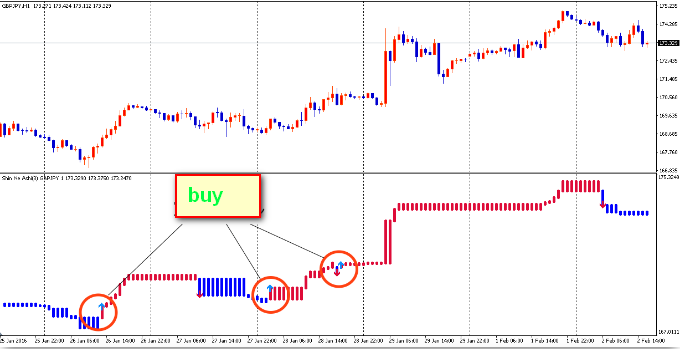
Buy signal
If a new positive line appears (positive), or if another positive line appears, it will be a buy signal . Also, it can be judged that the higher the number of hidden lines immediately before the positive run, the stronger the price increase.
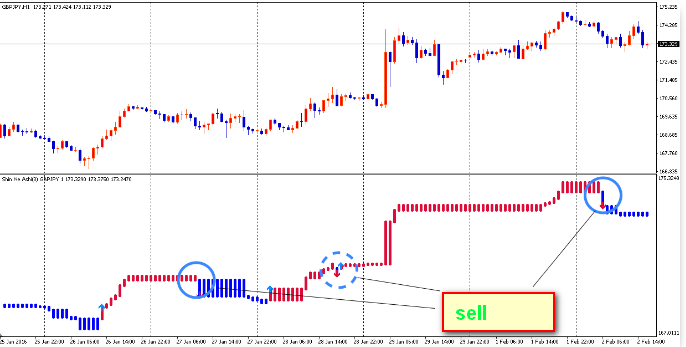
Sell signal
If new hidden lines appear (negative), or if one more hidden line appears, it becomes a selling signal . Also, it can be judged that the possibility of the ceiling is higher as the number of positive lines just before the reversion is larger.

The Shin Ne Ashi candlesticks are based on the closing price, and when the price rises above the previous high price in the rising market price, in the falling market it will fill in the new feet when it falls below the previous low price.
Therefore, when you update the high value in the upward phase, the positive line is entered, and when you update the low price at the descent price, the negative line will be filled in.
New value legs have non-time series new value feet and time series new value feet. In the case of non-time series new value feet, feet are not displayed unless there is a high price or low price update, but time series new price feet In the case of, it has the feature of changing the foot width or continuing to display by drawing the same foot until updating.
In the figure 1, the number of feet increases over time (even without updating the price), so it will be a time series new value feet.
There are various kinds of new value feet, but "commonly used three times" is commonly used in general. In the medium and long term, "new value five legs" "new value 10 legs" may be used.
New value Three legs do not add foot until the high value of the most recent three positive lines or the low value of the hidden line is updated , and lower the possibility of becoming a damascene to surely capture the turning point It is aiming.
Buy signal
If a new positive line appears (positive), or if another positive line appears, it will be a buy signal . Also, it can be judged that the higher the number of hidden lines immediately before the positive run, the stronger the price increase.
Sell signal
If new hidden lines appear (negative), or if one more hidden line appears, it becomes a selling signal . Also, it can be judged that the possibility of the ceiling is higher as the number of positive lines just before the reversion is larger.
- Rating: 0.6%
 Re: Something interesting please post here (Metatrader)
143
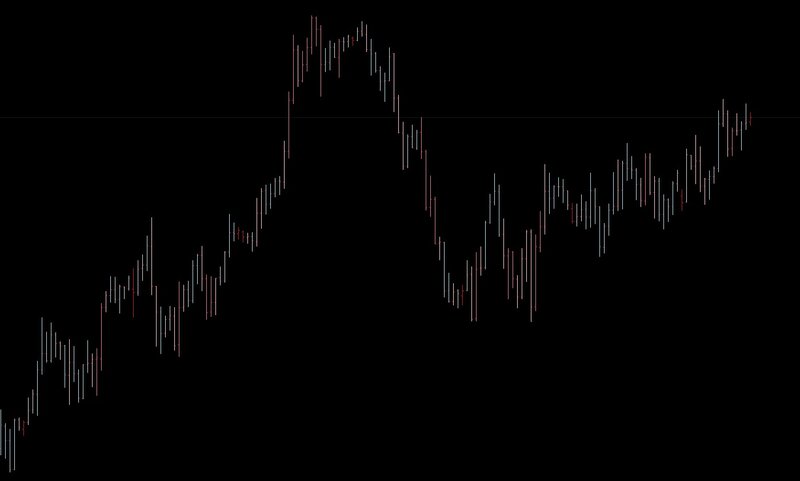
3-Candle-Chart
It is made of 3 candles per trading day:
Works only on 1 hour timeframe
Timeoffset variable is the offset (in hours) between GMT and your MT4 Broker's time
SBnumber variable is a funny number used to offset the whole group of candlesticks. It gives sometime surprising results.
Displays better on a line chart
It is made of 3 candles per trading day:
- London Open to New York Open
- New York Open to London Close (Power hours)
- London Close to New York Close
Works only on 1 hour timeframe
Timeoffset variable is the offset (in hours) between GMT and your MT4 Broker's time
SBnumber variable is a funny number used to offset the whole group of candlesticks. It gives sometime surprising results.
Displays better on a line chart
Re: Something interesting please post here (Metatrader)
144All Brilliant Candles Volume indicators for MT4
Re: Something interesting please post here (Metatrader)
145Floating Spread indicator
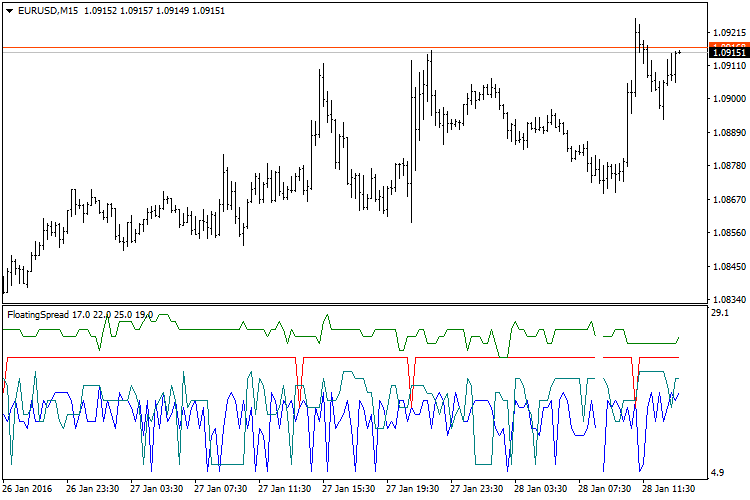
The indicator values are displayed only when new ticks appear. The indicator does not display history.
Description of the indicator settings:
The indicator values are displayed only when new ticks appear. The indicator does not display history.
Description of the indicator settings:
- Symbol_1 = "EURUSD"; — name of the first symbol to display.
- Symbol_2 = "GBPUSD"; — name of the second symbol to display.
- Symbol_3 = "USDCHF"; — name of the third symbol to display.
- Symbol_4 = "USDJPY"; — name of the fourth symbol to display.
- DrawBars = 130; — indicator display limitation, the number of bars. At = 0 displays on all available bars of the chart.
Re: Something interesting please post here (Metatrader)
146Trading Volume strength dashboard display indicator
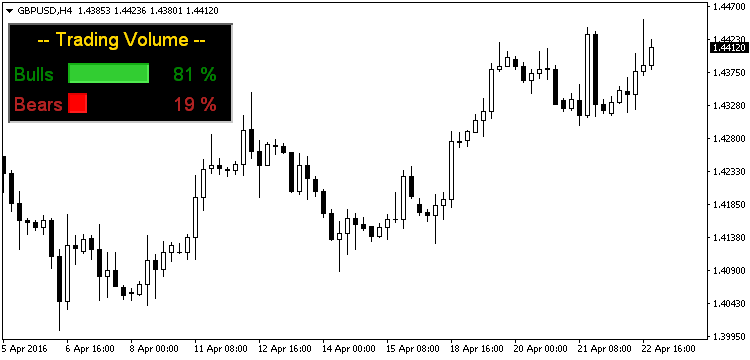
Trading Volume indicator shows the volume of Buying and Selling Trades on the Current Bar Or on average of specific number of last bars as you want
First: if you choose (CalculationBy = BidRatio)
The indicator calculates Buying and Selling Volumes Based on
Bid Price(Close Price)
Means that Bulls = Bid Price - Low Price
Bears = High Price – Bid Price
Second: if you choose (CalculationBy = OpenRatio)
The indicator calculates Buying and Selling Volumes Based on
Open Price
Means that Bulls = High Price - Open Price
Bears = Open Price – Low Price
Third: if you choose (CalculationBy = BodyRatio)
The indicator calculates Buying and Selling Volumes Based on
The Candle Body Length divided on total candle length with respect to its direction
Re: Something interesting please post here (Metatrader)
147Modified Heiken Ashi Ribbon MA style indicator
- These users thanked the author bilbao for the post:
- Chickenspicy
- Rating: 0.6%
Re: Something interesting please post here (Metatrader)
148The selected attachment does not exist anymore. 
Re: Something interesting please post here (Metatrader)
149Hi Anyway
Hope you are fine,please read this of MLADENs explanation regarding minor problem that is of course going to be solved immediately
Indicator is just a tool.
Use it only if it can benefit you. Leave it if you don't know how to use it optimally.
Use it only if it can benefit you. Leave it if you don't know how to use it optimally.
 Re: Something interesting please post here (Metatrader)
150
Open Interest indicator for MT4
Automatic determination of background and color scheme;
There is an opportunity to show levels and their values which are closest to the price, it also can show all of 15 strikes.
Now it is possible to change level brightness and show only levels background.
Numerical values of the Open Interest by Call\Put is optional,
Historical levels are optional.
When Open Interest Put values becomes greater than Open Interest Call values the indicator color is red (color of short position), if Call becomes greater than Put, it's blue (color of long position).
The color deep and brightness corresponds to the quantitative ratio of the Open Interest to its maximum level for this date, so now the level strength is more visual.
The numerical values of the levels corresponds to Call/Put ratios.