Looking through the old archives of files again, here's an old school Smoothed Ichimoku from 2011 by Mrtools which was revolutionary for it's time and is still a mighty good indicator today. Even though we have lots of different Ichimoku indicators here, this one is definitely a must-have for Ichimoku traders.
Thanks Mrtools!

Re: Ichimoku Indicators for MT4
152Hi mrtools
Chinkou Span Histogram indicators
MTF & alerts adding
thanks
Chinkou Span Histogram indicators
MTF & alerts adding
thanks
Re: Ichimoku Indicators for MT4
153No magic word?C0DE.19 wrote: Wed Jun 12, 2019 1:03 am Hi mrtools
Chinkou Span Histogram indicators
MTF & alerts adding
thanks
Re: Ichimoku Indicators for MT4
154I came across an interesting Ichimoku indicator from Prorealcode.
Description from the author:
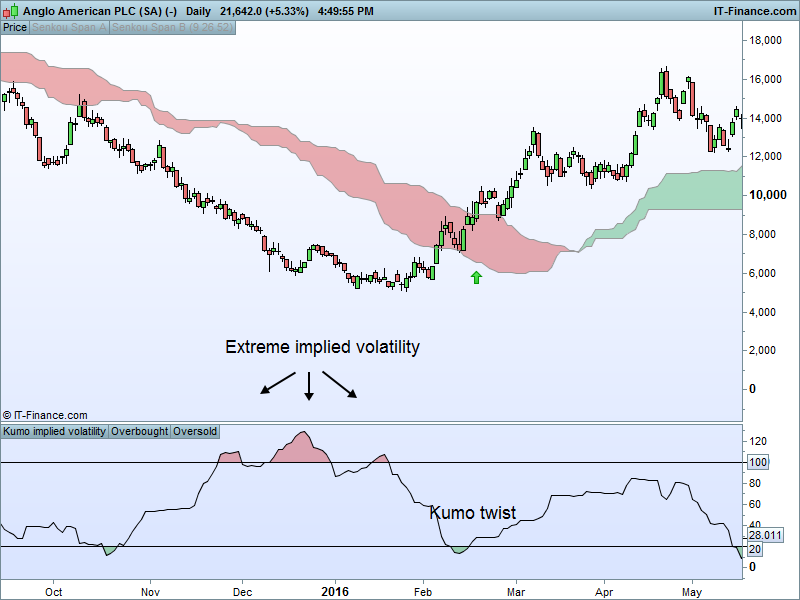
By simply looking at the "Kumo Line" we can determine if the volatility is there for a breakout.
Thanks
Description from the author:
There's a lot more to that prorealcode version but I was wondering if there's a simple version "Kumo Line" that only measures distance between Span A and Span B clouds with a setting for a look back period.In my pursuit to quantify the Ichimoku indicator, I have tried to quantify implied volatility by measuring the Kumo thickness. Firstly, I took the absolute value of the distance between SpanA and SpanB, I then normalized the value and created standard deviation bands. Now I can compare the Kumo thickness with the average thickness over 200 periods. When the value goes above 100, it implies that the Kumo is thicker than 2 standard deviations of the average (there is therefore only a 5% chance that this happens). A reading over 100 might indicate trend exhaustion and a reading below 20 indicates low volatility and Kumo twists (I chose 20 only by observation and not statistical significance). Interestingly, this indicator sometime gives similar information to ADX.
So far, the best use for this indicator is as a setup indicator for trend exhaustion or low volatility breakouts from Kumo twists. Extreme readings before Kumo breakouts looks interesting.Code: Select all
//Ichimoku
Tenkansen = (highest[9](high)+lowest[9](low))/2
Kijunsen = (highest[26](high)+lowest[26](low))/2
FutureSpanA = (tenkansen+kijunsen)/2
FutureSpanB = (highest[52](high)+lowest[52](low))/2

//Implied volatility based on Kumo thickness
Kumodepth = abs(FutureSpanA - FutureSpanB)

//Normalize implied volatility
Indicator = Kumodepth
AverageIndicator = average[200](Indicator)
StandardDeviation = STD[200](Indicator)
UpperBand = AverageIndicator + (2 * StandardDeviation)
LowerBand = AverageIndicator - (2 * StandardDeviation)
NormalizedIndicator  = ((Indicator - LowerBand) / (UpperBand - LowerBand)) * 100

Overbought = 100
Oversold = 20

Return NormalizedIndicator as "Kumo implied volatility", Overbought as "Overbought", Oversold as "Oversold"
By simply looking at the "Kumo Line" we can determine if the volatility is there for a breakout.
Thanks
Re: Ichimoku Indicators for MT4
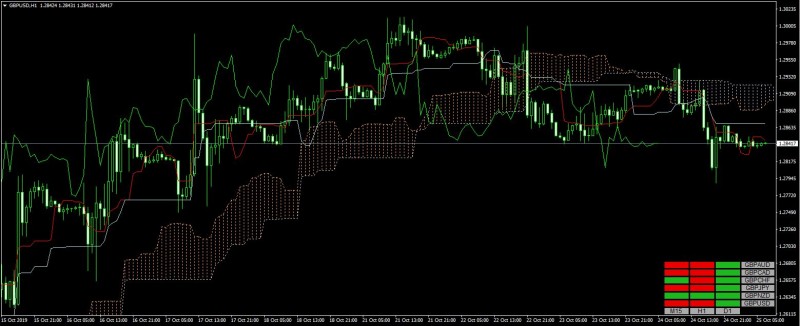
155This should be pretty close to the kumo implied volatility.dah wrote: Mon Sep 02, 2019 3:59 am I came across an interesting Ichimoku indicator from Prorealcode.
Description from the author:
There's a lot more to that prorealcode version but I was wondering if there's a simple version "Kumo Line" that only measures distance between Span A and Span B clouds with a setting for a look back period.
By simply looking at the "Kumo Line" we can determine if the volatility is there for a breakout.
Thanks
- Rating: 4.7%
Shalom Shalom! 
Re: Ichimoku Indicators for MT4
156I find it difficult to put into simple text how much I appreciate the efforts from people like you Mr. Tools. Although its not enough I will still say it many thanks I truly truly appreciate all of your time and effort that you put into helping others simply because you can.mrtools wrote: Mon Sep 02, 2019 11:38 am
This should be pretty close to the kumo implied volatility.
I'm excited to throw this on my charts and back test the results. And I'll be sure to follow up!
Best
Re: Ichimoku Indicators for MT4
157hello mrtools is it possible to add arrows and alerts (when colour turns to gray) please?mrtools wrote: Mon Sep 02, 2019 11:38 am
This should be pretty close to the kumo implied volatility.
Re: Ichimoku Indicators for MT4
159Hi Everyone!
Just joined and wanted to thank the forex-station team in providing many useful indicators. Made a change to one of the Ichimoku heatmaps which compares the price against the Kijun-sen.
Just joined and wanted to thank the forex-station team in providing many useful indicators. Made a change to one of the Ichimoku heatmaps which compares the price against the Kijun-sen.
- These users thanked the author Derptrader for the post:
- navlem
- Rating: 0.6%
Re: Ichimoku Indicators for MT4
160Hi Mladen/Mr Tools,
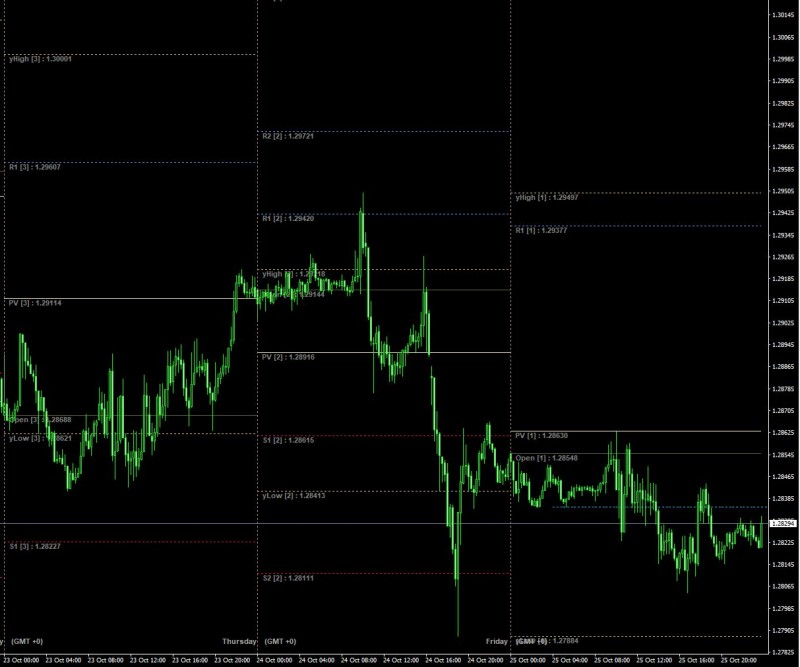
What I am trying to achieve here is to plot the daily Ichimoku levels similar to a pivot point indicator format (See attached picture). I have tried to modify some existing code to plot the Daily Kijunsen, Senkou A and Senkou B as well as the the 60 minute Kijun Sen at 5:00 GMT. However I am having some difficulty trying to get this to work. Would you be able to help me code this?
I was able to make some changes to Mladen's kumo heatmap tool for my own use and also shared this above. But I think I may have bitten off more than I can chew with this one.
Please find the three files I have been trying to use. The first one is able to plot the levels, however it does not plot the previous day and I am struggling to adjust this to plot the 60 minute Kijun Sen at the specified time. V2 is successful in getting the levels, however this only plots a vertical line. I have tried to do a V3 by modifying this, but I am having trouble getting the Ichimoku levels to plot.
The ideal outcome would be to have 8 buffers, with 4 being the daily time levels (KS, TS, SA, SB) and 4 being a lower time frame at a specified time, being able to toggle each one on/off and changing the line/color style.
If you can help, it would be greatly appreciated. Otherwise if this is getting into paid territory, please feel free to PM me.


