Re: Banzai Stuffs: backtestings, forex notes, etc...
83Abdi wrote: Sun Nov 06, 2022 3:38 am And if possible or not.
I would really like to thank you all amazing people who made and make this forum possible. Really. Thank you!
I'm more of a quiet observer, but really thankful that you make this possible!
Here is a small contribution. It's a (momentum breakout / ema pullback) scalping system based on the Bollinger Bands and the Rsi.
Hope you guys enjoy it.
Edit: for getting the template to work put the 'Impulse_BB_RSI_Scalper' folder in the main indicator's folder.
- These users thanked the author Banzai for the post (total 2):
- BeatlemaniaSA, vvFish
Re: Banzai Stuffs: backtestings, forex notes, etc...
84ANOTHER WAY TO TRADE CANDLESTICKS
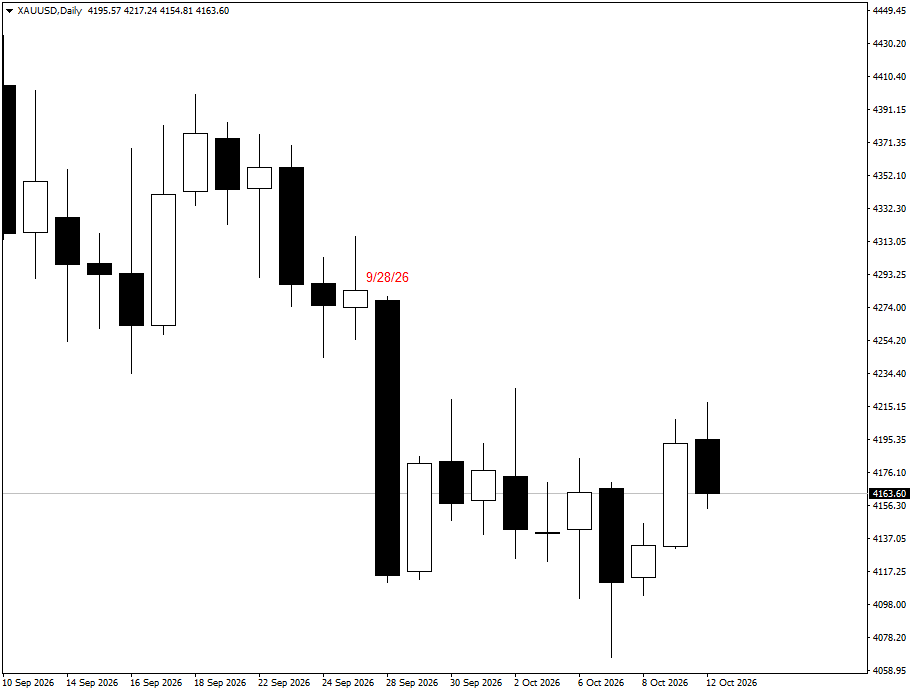 STEP 1: Choose a long bullish or bearish candle in the daily chart.
In this example, we will use the 9/28/26 bearish candle.
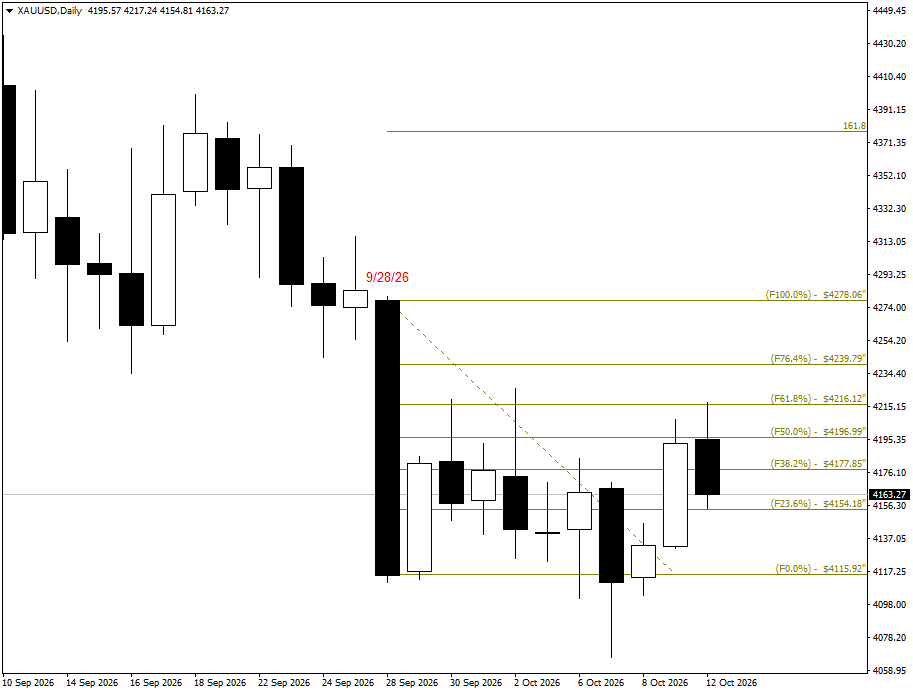 STEP 2: Draw a Fibonacci from the top body of the candle. Don't use the wicks.
The wicks are just overbought/oversold areas.
The Fibo golden zone is between 38.2% to 50.0% to 61.8%.
As you can see, the prices hit the golden zone and bounce back.
If the prices break out above Fibo 61.8%, then the trend is uptrend.
If the prices break out below Fibo 38.2%, then the trend is downtrend.
In this example, we will use the 9/28/26 bearish candle.
The wicks are just overbought/oversold areas.
The Fibo golden zone is between 38.2% to 50.0% to 61.8%.
As you can see, the prices hit the golden zone and bounce back.
If the prices break out above Fibo 61.8%, then the trend is uptrend.
If the prices break out below Fibo 38.2%, then the trend is downtrend.