Hi Mr.tools,
Thanks for the prompt response. Can you please explain what this logic does?
avg_inflow = sma(tsv > 0 ? tsv : na, tsv_bands_length)
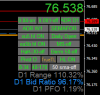
I implemented as per the tradingview, but I am getting only one line but not the band. Even the line also doesn't look right. What I have noticed in the tradingview was that, when tsv > 0, the current lower band has the same value as the previous value. It is vice versa when tsv < 0. I showed in the pic below with black circle. I am not sure whether my observation provide you any clue to implement the band.