gbp usd
5m chart
up down v6
Re: $100 Up Down V6 indicator
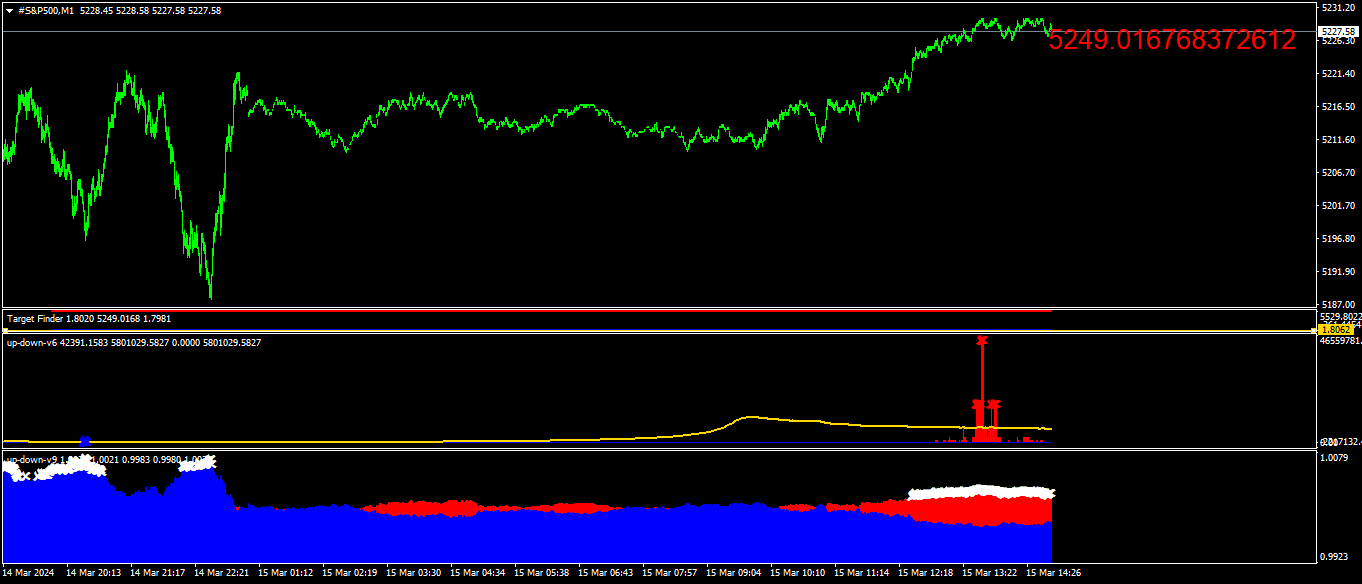
704The real question is how you adjust for instances like the one that happened below today with the US30 on the M1 timeframe:
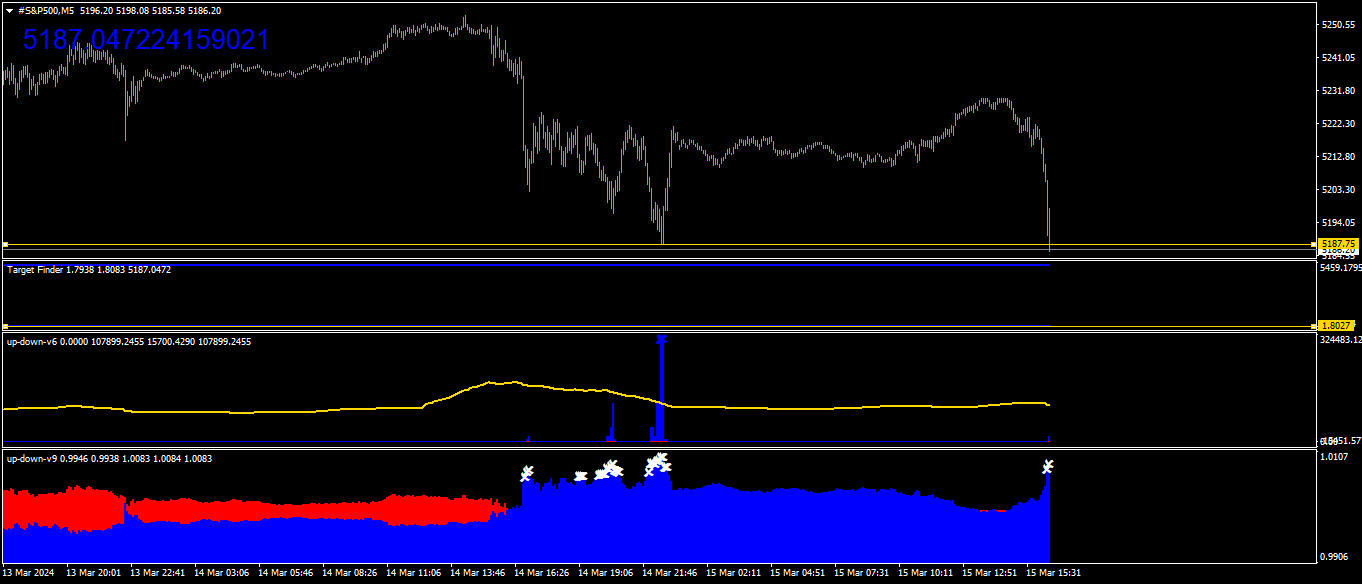
Notice that although Up Down V9 gives us two very long lines of repeated signals for buy and sell trades, we expect this as it's a short-term cycle indicator.
With Up Down V6 we get less of that but the same phenomenon occurs. At least we have a c-value that can be adjusted to have this happening less frequently, but the same cannot be said for V9.
Really goes to show why higher timeframe analysis and c-value adjustment are especially important during trending markets where price keeps on going up or down with no signs of stopping.
- These users thanked the author TransparentTrader for the post:
- anscari1714
- Rating: 0.6%
Re: $100 Up Down V6 indicator
705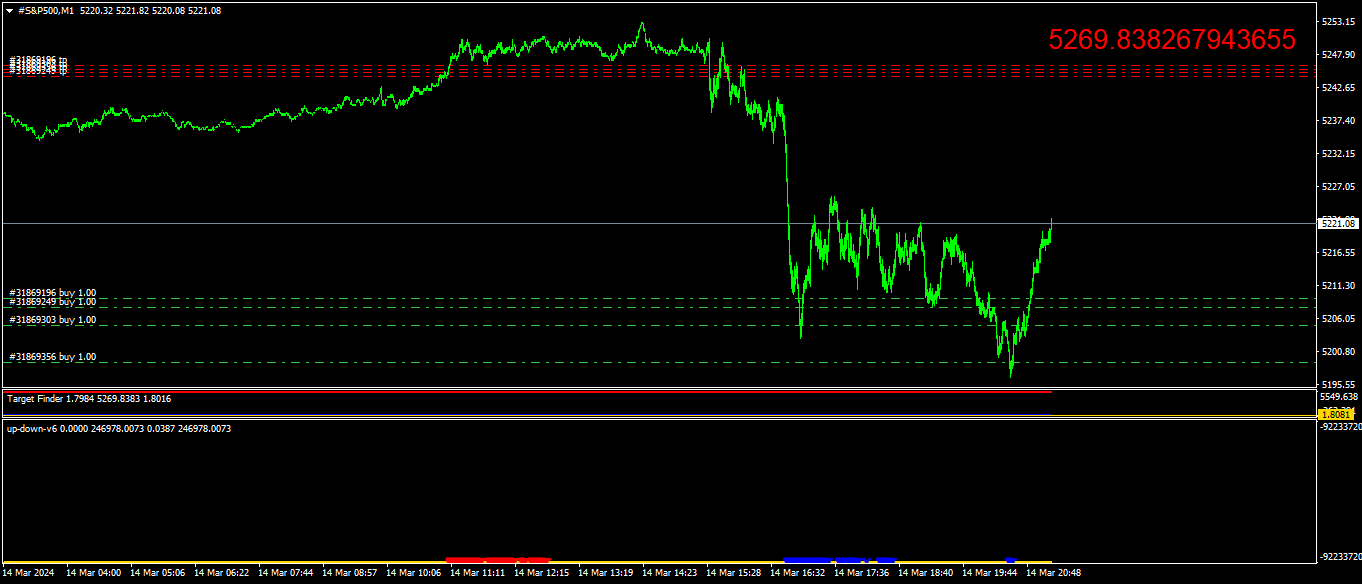
- These users thanked the author guner for the post:
- TransparentTrader
- Rating: 0.6%
Re: $100 Up Down V6 indicator
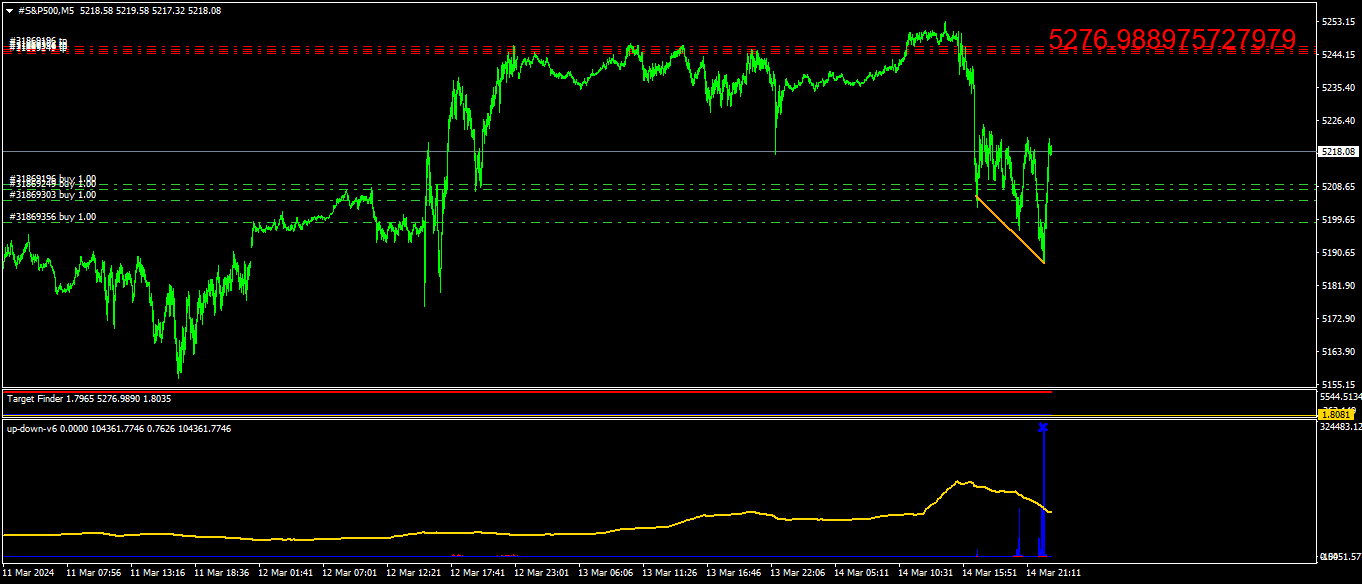
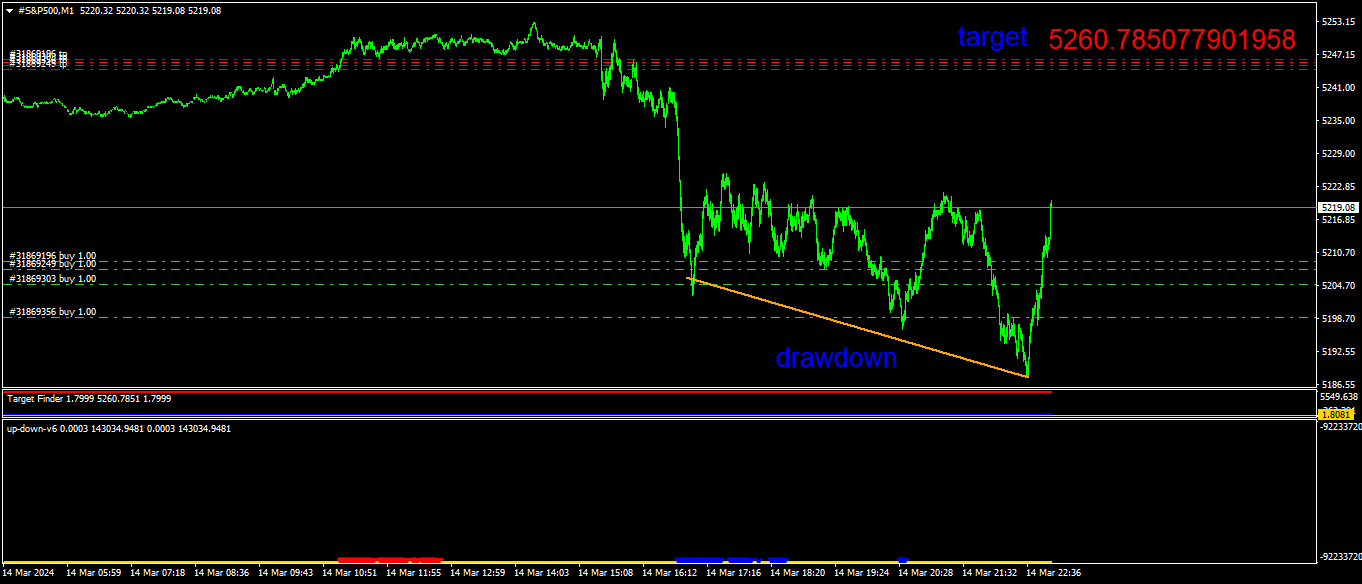
707Interesting that the last swing low didn't trigger a buy signal from the V6 indicator.
Guner, give that each trade was 1 lot size with your broker, can you tell us the drawdown you incurred for each individual trade and all 4 trades together when price was at that most recent swing low?
Also, what broker are you using to place these demo/live trades?