Who Can share Elliot Wave for Metatrader 5 Please !
Best Refards
Re: Elliot Wave for Metatrader 5
2here you goAxelJ wrote: Mon Nov 18, 2019 3:00 pm Who Can share Elliot Wave for Metatrader 5 Please !
Best Refards
Re: Elliot Wave for Metatrader 5
3Is there the Ellliot wave oscillator MT5 that have Yellow line as Peak oscillator same like MT4 ?
Thanks
Re: Elliot Wave for Metatrader 5
4Thanks my friend for the share but i need an indicator who show me the waves 1 2 3 4 5 in the charts
Re: Elliot Wave for Metatrader 5
6The oscillator should help with counting waves.
Here is an MT4 script that is useful for labelling waves in a simple way.
Probably could be easily adapted for use in MT5.
Note the include.
You need to change the options and recompile each time to label different waves with numbers/letters/font size etc.
Econome.
Here is an MT4 script that is useful for labelling waves in a simple way.
Probably could be easily adapted for use in MT5.
Note the include.
You need to change the options and recompile each time to label different waves with numbers/letters/font size etc.
Econome.
Re: Elliot Wave for Metatrader 5
7Elliot Wave Squeeze Oscillator UPDATED V1.0
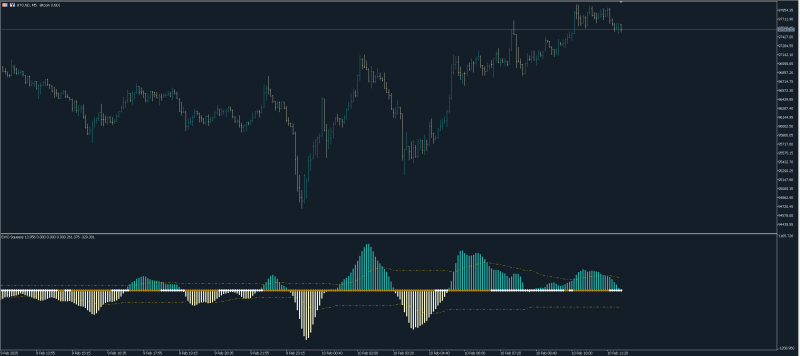
The EWO Squeeze indicator is a hybrid tool that fuses momentum analysis with volatility compression signals to pinpoint potential breakout opportunities. It comprises three key elements:
-Histogram Bars: These represent the Elliott Wave Oscillator (calculated as the difference between a fast and a slow moving average of the close) and indicate the strength and direction of momentum.
-Breakout Bands: These are dynamic, recursively updated lines that outline the oscillator’s normal range. When the oscillator breaks out of these bands, it signals an abnormal momentum surge. It has options for both standard deviation and exponential smoothed bands.
-Compression Dots: These appear during periods of low volatility (when Bollinger Bands are fully contained within Keltner Channels) and warn that a significant price move may soon follow.
The overall goal is to alert traders to phases of volatility compression and to provide early signals for potential trend breakouts.
HOW TO USE IT
-For Long Entries: Look for the histogram shifting into positive territory and breaking above the upper breakout band; the compression dots should vanish or switch, indicating the end of a squeeze and the start of an upward impulse.
-For Short Entries: Seek confirmation when the histogram turns negative and breaches below the lower breakout band; again, a change in the compression dots signals a release of low volatility and the potential onset of downward momentum.
-Exits: Consider exiting when the histogram loses momentum, the breakout bands start to reconverge, or when opposing signals appear (such as a reversal in the squeeze condition).
This version is an optimized version of the original trading view script:
https://www.tradingview.com/script/2T3A ... M-Squeeze/
Change Log V1.0
-Performance improvements
-Added Alerts (standard alerts are fired when a bullish histogram breaks the upper band, or a bearish one breaks the lower band. Option to use the squeeze as filter)
"I conjure from shadows and shape fortunes from the unseen. The treasure lies hidden in plain sight, beneath the sunlight." - Cagliostro
Re: Elliot Wave for Metatrader 5
8Please redownload the updated version.
"I conjure from shadows and shape fortunes from the unseen. The treasure lies hidden in plain sight, beneath the sunlight." - Cagliostro
Re: Elliot Wave for Metatrader 5
9Hi cagliostro. congrats on moving to mt5 , i'm still strugling to be in tune with it {mt5}yet ,so sticking with mt4 for the time being. pls do you have the mt4 of the Elliotwave squeeze oscilators?. Thanks.Cagliostro wrote: Mon Feb 10, 2025 9:11 pm Elliot Wave Squeeze Oscillator UPDATED V1.0
image_2025-02-10_105256970.png
The EWO Squeeze indicator is a hybrid tool that fuses momentum analysis with volatility compression signals to pinpoint potential breakout opportunities. It comprises three key elements:
-Histogram Bars: These represent the Elliott Wave Oscillator (calculated as the difference between a fast and a slow moving average of the close) and indicate the strength and direction of momentum.
-Breakout Bands: These are dynamic, recursively updated lines that outline the oscillator’s normal range. When the oscillator breaks out of these bands, it signals an abnormal momentum surge. It has options for both standard deviation and exponential smoothed bands.
-Compression Dots: These appear during periods of low volatility (when Bollinger Bands are fully contained within Keltner Channels) and warn that a significant price move may soon follow.
The overall goal is to alert traders to phases of volatility compression and to provide early signals for potential trend breakouts.
HOW TO USE IT
-For Long Entries: Look for the histogram shifting into positive territory and breaking above the upper breakout band; the compression dots should vanish or switch, indicating the end of a squeeze and the start of an upward impulse.
-For Short Entries: Seek confirmation when the histogram turns negative and breaches below the lower breakout band; again, a change in the compression dots signals a release of low volatility and the potential onset of downward momentum.
-Exits: Consider exiting when the histogram loses momentum, the breakout bands start to reconverge, or when opposing signals appear (such as a reversal in the squeeze condition).
This version is an optimized version of the original trading view script:
https://www.tradingview.com/script/2T3A ... M-Squeeze/
Change Log V1.0
-Performance improvements
-Added Alerts (standard alerts are fired when a bullish histogram breaks the upper band, or a bearish one breaks the lower band. Option to use the squeeze as filter)
Re: Elliot Wave for Metatrader 5
10Hi there - no did not create an MT4 version as I switched to MT5 and at the moment am not putting much efforts on MT4 unless I decide to swap back.
- These users thanked the author Cagliostro for the post:
- Topguy7
"I conjure from shadows and shape fortunes from the unseen. The treasure lies hidden in plain sight, beneath the sunlight." - Cagliostro