OK friends , Let's look at EUR/GBP chart ,
On daily time frame we had a trend line which acts good , and a regression channel , up cross moving averages ,
On H1 , we have a good support area , a RD+ on bbsqueeze , a trend line ,
wait for H1 trigger , up cross moving averages , turning on bbsqueeze engine , breaking trend line , ...
if BUY signal would be OK , stop is under 0.8640
Re: MACD&RSI's Trading
22EUR/GBP is moving in our direction ,
Now we are waiting for bbsqueeze engine to getting red , it is orange now , I show it by a blue triangle on EUR/AUD chart. TP1 and TP2 is showed on chart , and so The middle line of andrew's pitchfork would be the final target .
STOP would be at 1.4080.
hope big profit for every body
Now we are waiting for bbsqueeze engine to getting red , it is orange now , I show it by a blue triangle on EUR/AUD chart. TP1 and TP2 is showed on chart , and so The middle line of andrew's pitchfork would be the final target .
STOP would be at 1.4080.
hope big profit for every body
Attachments
Re: MACD&RSI's Trading
24Hi macd&rsimacd&rsi wrote:I set target of EUR/GBP to 0.88.
EUR/AUD trade has been activated.
pretty setup,thanks for your contribution,it really helping others
Indicator is just a tool.
Use it only if it can benefit you. Leave it if you don't know how to use it optimally.
Use it only if it can benefit you. Leave it if you don't know how to use it optimally.
Re: MACD&RSI's Trading
25EUR/GBP closed at entry point by GBP news , cuz I moved stop to entry point .
EUR/AUD hit stop badly .
Now , let's look at EUR/USD .
On daily and H4 we have a good bullish trend ,RSI and bbsqueeze are on bullish trend also ,
but at H1 time frame ,it shows a neutral trend , waiting for turning on bbsqueeze engine ,RSI goes up the center line (50) , I showed it in a gray rectangle .
IF it can go higher than 1.085 , the next target would be 1.11 , 1.12 , 1.13.
Attachments
Re: MACD&RSI's Trading
26Flag pattern is one of the most probability patterns in technical analyses world .
Based on the above link and figure , we have a bullish flag on the EUR/GBP H4 chart , RSI on 50 center line , bbsqueeze engine is on , price stands on 50% fibonacci , so it would be a good long position , if we will have a powerful break and two moving averages cross . Target ( as I show on the above figure ) can be set at 0.9 , also it means 161.8% fibonacci , an important level in price moving .
On daily chart we can see two important lines , which I drew them , bbsqueeze engine is on and two moving averages is crossed up , RSI is at good mood , may be we have another resistance on breaking bearish trend line on RSI .
I follow H1 chart , to have a good entry point , when bbsqueeze engine getting on ,and RSI shows a good energy for bullish trend .
have a good days and profitable days !!
Attachments
Re: MACD&RSI's Trading
27Could somebody send me the link to the RSI of MACD indicator?
Couldn't find it.
Couldn't find it.
Re: MACD&RSI's Trading
28Hi gelsasgelsas wrote:Could somebody send me the link to the RSI of MACD indicator?
Couldn't find it.
I tried with search function and that return me dozens reply/links .... even then we are here to help you if you have some thing specific in mind.
regards
Indicator is just a tool.
Use it only if it can benefit you. Leave it if you don't know how to use it optimally.
Use it only if it can benefit you. Leave it if you don't know how to use it optimally.
Re: MACD&RSI's Trading
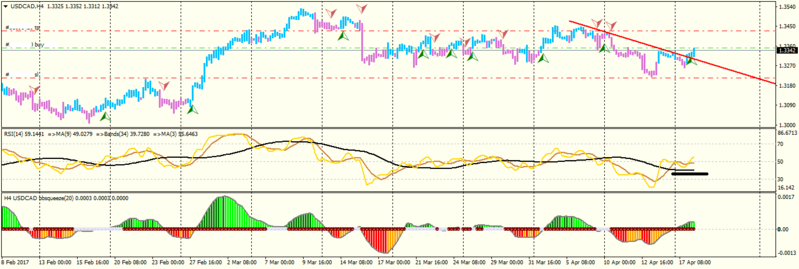
29HELLO friends ,
Let's have look at USD/CAD
based on squeeze system , I took a position ,
hope hit the target !!
Let's have look at USD/CAD
based on squeeze system , I took a position ,
hope hit the target !!
Re: MACD&RSI's Trading
30Now , I was looking at all my posts , and I saw my last post which was about BULLISH GBP/USD , was deleted.
and the EUR/GBP analyses was written two times .
is it possible replacing deleted post?
thank you
and the EUR/GBP analyses was written two times .
is it possible replacing deleted post?
thank you