ionone wrote:
the base indicator loooks an awful lot like RVI (it's been modified BTW)

screenshot.1560.jpg
ionone wrote: Thu Jan 15, 2026 2:50 am
the base indicator loooks an awful lot like RVI (it's been modified BTW)
screenshot.1560.jpg
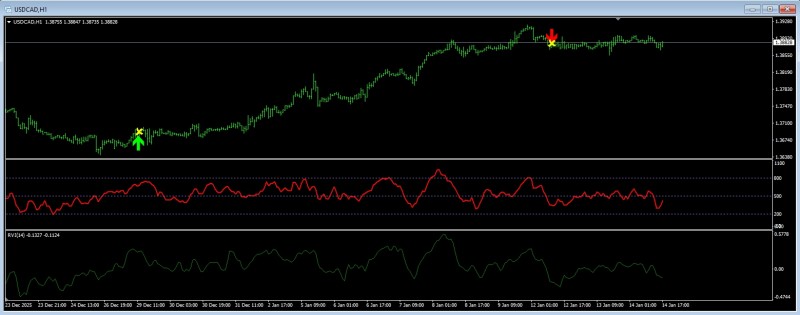
"It might look like RVI at first glance, but the logic and mathematics behind it are completely different. This tool is my own modification of Larry Williams' concept (LWPI) – it measures the statistical deviation of price from its fair value rather than simple momentum. RVI will never 'clamp' the line to the edge or keep it flat during a strong price rally; here, the Clamping & Flattening function is key to filtering out market noise.
The signals are also structured differently because the system is based on Action-Reaction logic. The arrows always alternate (Buy -> Sell), which eliminates clutter on the chart during strong trends. Just a tip from me – if you crank up the parameters significantly, you'll see those arrows hitting bullseye targets, as the indicator starts catching only the most extreme reversal points. Throw it on a chart next to RVI, and you'll quickly spot the difference in price reaction. Good luck!"
 Re: Identify This Indicator