Re: Dashboard Type Indicators for MT4

311
Knight wrote: Sat Jul 09, 2022 10:08 am ouch. it means I can't use that then. Is anyone else having the same issues?

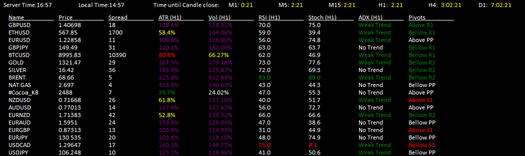
by the way, I made an heiken ashi version of your MTF rsi dashboard. it was inspired by you.
Image
I did as well, with the same indicator. However, the problem is that indicator is giving you the current Heikin Ashi (HA) candle, not the previous one. So if you make a trade decision based on the current candle, it could change by the end of the TF and you will regret your decision. HA gives you the overall direction and price usually follows in that direction, mathematically speaking. But you have to go by the previous HA candle, NOT current!

I'll explain my rationale behind HA. I've attached EURUSD, Daily TF for 2021. If you were to trade in the direction of the previous HA candle, you would be wrong 54 times (days when the HA candle changed color) out of 365 days. That means you would've been right 85% of the year (54/365=.147; 1 - .147 =.853). So I thought to myself, what if I look at the entire basket of currencies the same way, it should increase my odds statistically. So now I know where to look specifically for trade setups. Next, you just need to confirm entries with whatever setup you are comfortable with. Volatility is key. You want to make sure there is still gas in the tank on the currency pair, otherwise you may have a lot of drawdown.

The HA setup is perfect for anyone because it reveals where the trade setups are. So no matter your strategy, it can increase your odds. One note I would recommend, enter on a timeframe below the HA TF you select as your directional bias (DB). For instance, I leave my HA setup on the Daily TF (DB) and enter on the 4HR. If you trade the 1 hour, have the HA on the 4hr TF for your directional bias. Hope this helps!

P.S. Excellent job, by the way on the HA setup. It's a lot of work, ins't it? But it's a part of the learning process.
Attachments
These users thanked the author naluvs01 for the post (total 4):
W35, Knight, Chickenspicy, Yaya20


Re: Dashboard Type Indicators for MT4

312
naluvs01 wrote: Sun Jul 10, 2022 12:06 am I did as well, with the same indicator. However, the problem is that indicator is giving you the current Heikin Ashi (HA) candle, not the previous one. So if you make a trade decision based on the current candle, it could change by the end of the TF and you will regret your decision. HA gives you the overall direction and price usually follows in that direction, mathematically speaking. But you have to go by the previous HA candle, NOT current!

I'll explain my rationale behind HA. I've attached EURUSD, Daily TF for 2021. If you were to trade in the direction of the previous HA candle, you would be wrong 54 times (days when the HA candle changed color) out of 365 days. That means you would've been right 85% of the year (54/365=.147; 1 - .147 =.853). So I thought to myself, what if I look at the entire basket of currencies the same way, it should increase my odds statistically. So now I know where to look specifically for trade setups. Next, you just need to confirm entries with whatever setup you are comfortable with. Volatility is key. You want to make sure there is still gas in the tank on the currency pair, otherwise you may have a lot of drawdown.

The HA setup is perfect for anyone because it reveals where the trade setups are. So no matter your strategy, it can increase your odds. One note I would recommend, enter on a timeframe below the HA TF you select as your directional bias (DB). For instance, I leave my HA setup on the Daily TF (DB) and enter on the 4HR. If you trade the 1 hour, have the HA on the 4hr TF for your directional bias. Hope this helps!

P.S. Excellent job, by the way on the HA setup. It's a lot of work, ins't it? But it's a part of the learning process.
Image

It is a lot of work, thank you very very much. You made it super easier with your RSI setup, I literally had to just copy your steps and follow you with little changes here and there, but you laid the blueprint for everything and for that I'll be forever grateful.

I totally understand you and you're absolutely right. But I feel there is an easy fix for that. I trade only continuations in the direction of a higher timeframe, so my directional bias is the daily and my entry is on1hr. To solve the heiken ashi problem why not only check for daily bias shortly before the end of the day, say 1hr or 30mins, there's no way you would get a change by that time, the market would be stable and you can see everything clearly going into the next day.

I do my daily analysis shortly before market close, get a watchlist, then follow that watchlist throughout the day with my entry system on my entry timeframe.

have you considered this approach?
These users thanked the author Knight for the post (total 2):
Chickenspicy, Yaya20

Re: Dashboard Type Indicators for MT4

313
Knight wrote: Sun Jul 10, 2022 7:02 am It is a lot of work, thank you very very much. You made it super easier with your RSI setup, I literally had to just copy your steps and follow you with little changes here and there, but you laid the blueprint for everything and for that I'll be forever grateful.

I totally understand you and you're absolutely right. But I feel there is an easy fix for that. I trade only continuations in the direction of a higher timeframe, so my directional bias is the daily and my entry is on1hr. To solve the heiken ashi problem why not only check for daily bias shortly before the end of the day, say 1hr or 30mins, there's no way you would get a change by that time, the market would be stable and you can see everything clearly going into the next day.

I do my daily analysis shortly before market close, get a watchlist, then follow that watchlist throughout the day with my entry system on my entry timeframe.

have you considered this approach?
That is definitely a work around, but I like to see a reference point continuously. Here is another indicator I found as a backup, if the one I use ever went out. The problem is the indicators move every time you rescale the screen. The indicators I currently use automatically rescale properly with the text adjusting as well. I wish Mr. Tools or another coder could correct that problem, I would use it instead because the names appear within the indicator. But it's an EX file. Hope this helps!

P.S. You can move the indicator around by the upper right corner. But it doesn't matter because if you resize the screen, they all move. Also, this indicator doesn't limit you to 30 either. You can do a hundred or whatever...
These users thanked the author naluvs01 for the post (total 3):
Chickenspicy, Jedidiah, Yaya20

Re: Dashboard Type Indicators for MT4

314
naluvs01 wrote: Sun Jul 10, 2022 11:06 pm That is definitely a work around, but I like to see a reference point continuously. Here is another indicator I found as a backup, if the one I use ever went out. The problem is the indicators move every time you rescale the screen. The indicators I currently use automatically rescale properly with the text adjusting as well. I wish Mr. Tools or another coder could correct that problem, I would use it instead because the names appear within the indicator. But it's an EX file. Hope this helps!

P.S. You can move the indicator around by the upper right corner. But it doesn't matter because if you resize the screen, they all move. Also, this indicator doesn't limit you to 30 either. You can do a hundred or whatever...
Image
Woah, Thanks a lot, it works exactly with the same rules as before right? we are only looking at the 5th column before the last one right?


Re: Dashboard Type Indicators for MT4

316
Darks wrote: Mon Oct 05, 2020 1:39 am A nice dashboard indicator. Code can be helpful for learning and further development.

Description by author :

The Multi Forex Scanner indicator is a MT4 indicator that I developed because I wanted to save time finding good pairs to trade.

It shows the list of currencies available in the Market Watch window. If you wish to hide any currency, just hide it in the Market Watch.

I hope it helps you.
Image


Settings
Image


Update interval (secs) – Allows you to define the interval in which the indicator is updated. This is to prevent performance issues.
Font Size – Allows you to define the font size of the text shown on screen.
Font Name – Allows you to define the font of the text shown on screen.
—————————————————
Show Price – Show/Hide the Price column. This column shows the Bid of the currency.
—————————————————
Show Spread – Show/Hide the Spread column. This column shows the Spread of the currency.
—————————————————
Show ATR – Show/Hide the ATR column. This column shows the percent of the current bar in relation to the calculation of the ATR.
ATR Timeframe – The timeframe to use in the ATR calculation.
ATR Period – The period to use in the ATR calculation.
—————————————————
Show Volume – Show/Hide the Volume column. This column shows the percent of the current bar volume in relation to the average of the previous volumes.
Volume Timeframe – The timeframe to use in the calculation of the average volume.
Volume Period -The period to use in the calculation of the average volume.
—————————————————
Show RSI – Show/Hide the RSI column. This column show the RSI for the current bar. If the RSI is overbought the data is green. If the RSI is oversold, the data is red.
RSI Timeframe – The timeframe of the RSI calculation
RSI Period – The period of the RSI
RSI Upper Level – The upper level of the RSI. Allows to detect overbought.
RSI Lower Level – The lower level of the RSI. Allows to detect oversold.
—————————————————
Show Stochastic – Show/Hide the Stoch column. This column shows the Stochastic value for the current bar.
Stoch Timeframe – The timeframe of the Stochastic calculation.
%K period – The %K parameter of the Stochastic.
%D period – The %D parameter of the Stochastic.
Slowing – The Slowing of the Stochastic.
MA Method – The Moving Average method of the Stochastic.
Price Field – The Price Field parameter of the Stochastic.
Stoch Upper Level– The upper level of the Stochastic. Allows to detect overbought.
Stoch Lower Level– The lower level of the Stochastic. Allows to detect oversold.
—————————————————
Show ADX – Show/Hide the ADX column. This column interprets the value of the ADX according to the levels 25, 50 and 75.
ADX Timeframe – The timeframe used in the calculation of the ADX.
ADX Period – The period of the ADX.
ADX Applied Price – The applied price of the ADX.
—————————————————
Show Pivots – Show/Hide the Pivots column. This column displays the position of price in relation to the closest pivot level.
—————————————————
Show MA – Show/Hide the MA column. This column shows if price is above or below the configured moving average
MA Timeframe – The timeframe used in the calculation of the MA.
MA Period – The period of the MA.
MA Method – The method of the MA.
MA Applied Price – The applied price of the MA.
Congratulations for the work!!! I think it's great who knows how to program! My entry trade system is based on 3 indicators, existing and accelerating ADX, crossing the average 3 with 8 and Bollinger Bands, which in this case I use the BB Trend Flat indicator. Could you make me a dasboard with these 3 indicators, with all the time frames and with alerts with the 3 in the same direction? If yes, how much would you charge me? Thank you in advance and congratulations again!!!


Who is online

Users browsing this forum: Amazon [Bot], ChatGPT [Bot], CrisBarbedo, Google [Bot], Jonex1995, levchuk, Steam1 and 73 guests