Hi,
Trying a bit twisted version 2nd dot to me haos looks working well with
Re: XARD - Simple Trend Following Trading System
4602another trade another win *on 30 min it's a red dot.1hr a green dot indicating buy,also on m15 green dot 2nd dot',waited for the price to cross over the small line blue candles and 50 pips tp.Entry 1944,tp 1449 Have a good trading day
Re: XARD - Simple Trend Following Trading System
4603Hi Rob,Senior Rob wrote: Thu Oct 22, 2020 3:32 am
You don't do yourself justice, our kid! Even though you developed it for Indices, it works perfectly well on TRENDING currencies!
The strategy is to IGNORE the last semafor dot/square and trade off the CONFIRMED semafor dot/square on the next higher time frame. (XARD: ...and all this time I thought confirmation was at the 2nd DOT).
Since this is a "SIMPLE TREND FOLLOWING TRADING SYSTEM" we need to trade in accordance with Newton's first law of motion which states:
""An object at rest stays at rest and an object in motion stays in motion with the same speed and in the same direction unless acted upon by an unbalanced force"".
In trading terms this means PRICE will continue to go higher and make higher highs and higher lows UNTIL it reaches a SUPPLY level (or RESISTANCE) where sellers are waiting to SELL. Eventually the sellers will create a pull back and a lower high and lower low and then the RED semafor square/dot will be confirmed and glued in place.
As with ALL "Trend Following Trading Systems" this is CRAP when PRICE is trading in a range or consolidation and will drain your account if you try to use it to trade under such conditions.
Thanks Xard
Cheers,
Rob
That's a great explanation, and I believe by the laws of physics and Newton's explanation, a great many will understand it better.
We create order out of chaos - we trade that order, but sometimes that chaos is out of order, so we WAIT!!! for the order to return - and we trade again. XARD777
Re: XARD - Simple Trend Following Trading System
4604What goes up must come down." - Isaac Newton . The problem is knowing when 
Re: XARD - Simple Trend Following Trading System
4606Not soo much signals in H1 soo day for scalp in M5 looking M15.
- These users thanked the author Cladi39 for the post:
- StuartWong
Re: XARD - Simple Trend Following Trading System
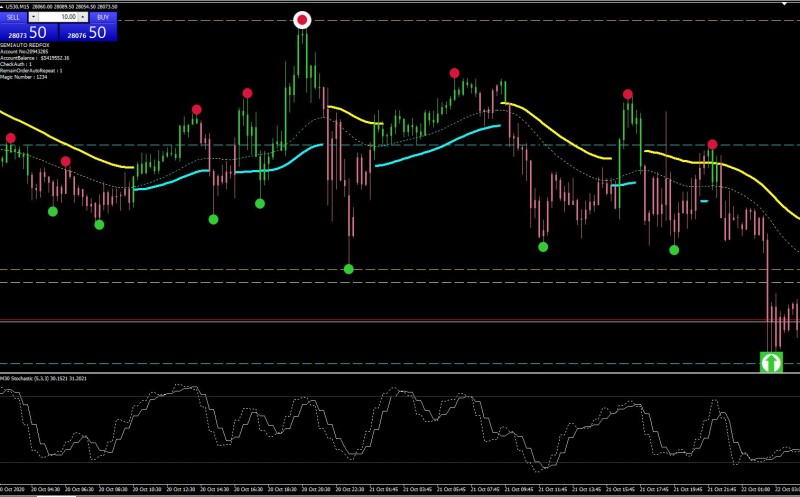
4607Oh well, I totally messed that up.
I said to myself that the market was going down (based on 4hr not crossing above the Trend) and placed a SELL (as you do).
As it was going down I thought I will test the screenshot so I hit the chicken switch thinking great, it's taken a snapshot. At which point I realised that I was out the market and I just watched like a rabbit caught in the headlights as the market plummeted another +160 Pips in about 15 seconds and all I could do was say Shiiiiit!
I am laughing about it now, anyway, the good news is that the screenshot worked.
XARD777
You can see (if you zoom in) where I got out of the trade and the move continue way down another 160 pips.
Defo a senior moment.
- These users thanked the author xard777 for the post (total 7):
- fadhayemustafa, stond, Thangarasu, Mundu19, tokjanggut, Jedidiah, StuartWong
XARD: If Carlsberg made charts... Probably the best charts in the world
Re: XARD - Simple Trend Following Trading System
4608I you look in M30 you can catch good entryes on M5
Re: XARD - Simple Trend Following Trading System
4609Exactly, Cladi, that's what it is all about. Whatever TF one trades it needs to be in sync with the higher TF and one hardly can get it wrong.
One can for example scalp the 5m all day if it is in sync with the 15 and.....the more the better and the longer the move.
In the following chart I use a MTF Stochastic for convenience...i.e. it shows the direction on the higher TF.
It doesn't really matter what indicators you use on the chart. Anything that suits you. Even just a SMA.
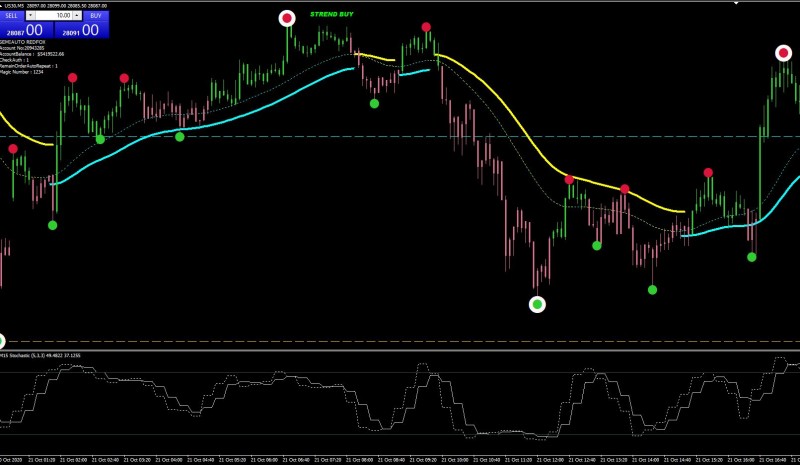
And the 15m in sync with the 30m......you still can scalp the 5m for longer moves.
One can for example scalp the 5m all day if it is in sync with the 15 and.....the more the better and the longer the move.
In the following chart I use a MTF Stochastic for convenience...i.e. it shows the direction on the higher TF.
It doesn't really matter what indicators you use on the chart. Anything that suits you. Even just a SMA.
And the 15m in sync with the 30m......you still can scalp the 5m for longer moves.
Re: XARD - Simple Trend Following Trading System
4610my MMAvg indicator always displays a 5th row of squares at the bottom
XARD: It's just my crappy coding, not to worry, MMAvg is coming off the charts and moving to the Dashboard in next update.
XARD: It's just my crappy coding, not to worry, MMAvg is coming off the charts and moving to the Dashboard in next update.


