Re: XARD - Simple Trend Following Trading System
4381Love the VWAP.....Have been using it for a few days. Always in the direction of 1H-15m. Hard to get it wrong.
You need to edit the indicator settings in your code. Match with your data. It was written before how to do it.jolugarpe wrote: Fri Oct 16, 2020 11:13 pm Sorry Sr. Xard, why my adr indicator is so short, appear ADR 59. Further, in WS30 is more litlle, and why my numbers of dash board are biggers.
Thanks a lot
[img][attachment=0]SPX500M5.
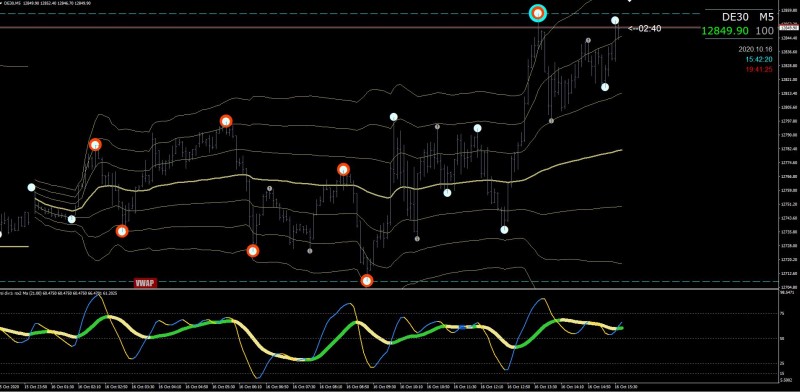
xard777 wrote: Fri Oct 16, 2020 9:53 pm Hi Everyone, I am trying to simplify the whole dot process so that we are all on the same page.
Gold Square = Trend Top, we should see the market go DOWN from here.
Red Square = Cycle Top, we want to take SELL trades off the Red Dots from the Red Square.
White Circles = temporary market change i.e Pullback/Continuation of the cycle.
Green Square = Cycle Bottom, we want to take BUY trades off the Green Dots from the the Green Square.
Blue Square = Trend Bottom, we should see the market go UP from here.
And it goes without saying that the 2nd Dot is where is all kicks off.
Hope this makes sense and is easier to follow.
Anyway, let me know what you think.
All the best
Xard777
Update - The idea is that we would do our MAIN Trading off the 1hr & 15m TFs as the dots are in sync.
We could of course then use the 5m purely for the scalping of (as you do).
Looking sooo forward to this!xard777 wrote: Sat Oct 17, 2020 1:25 am I don't know if it was just blind luck but this is the perfect example of how it all should play out.
This enclosed image is text book - pls study.
Gold Square = Trend Top, we should see the market go DOWN from here.
Red Square/White DOWN Arrow = Cycle Top, we want to take SELL trades off the Red Dots from the Red Square.
White Circles = temporary market change i.e Pullback/Continuation of the cycle.
Green Square/White UP Arrow = Cycle Bottom, we want to take BUY trades off the Green Dots from the the Green Square.
Blue Square = Trend Bottom, we should see the market go UP from here.
Trade the 1hr/15m charts (scalp the 5m)
I will post an update over the weekend.
Xard777
Sorry Xard for asking but you lost me on this one ?xard777 wrote: Sat Oct 17, 2020 1:25 am I don't know if it was just blind luck but this is the perfect example of how it all should play out.
This enclosed image is text book - pls study.
Gold Square = Trend Top, we should see the market go DOWN from here.
Red Square/White DOWN Arrow = Cycle Top, we want to take SELL trades off the Red Dots from the Red Square.
White Circles = temporary market change i.e Pullback/Continuation of the cycle.
Green Square/White UP Arrow = Cycle Bottom, we want to take BUY trades off the Green Dots from the the Green Square.
Blue Square = Trend Bottom, we should see the market go UP from here.
Trade the 1hr/15m charts (scalp the 5m)
I will post an update over the weekend.
Xard777


