One method Xard mentioned before is to wait for the candle and background to change colour to the direction that you want.
Re: XARD - Simple Trend Following Trading System
1422Thanks. I understand that waiting for the candle may not help me ch as if the market keeps pushing in the direction opposite to the semafor color then it would just change its location regardless of the previous candle closing while the semafor is on it.... now, what does the background color represent?..... I was also thinking of waiting till both MA lines cross with the same color confirming the bias of the semafor color.... did anyone try that ?..navlem wrote: Wed Feb 12, 2020 12:29 am
One method Xard mentioned before is to wait for the candle and background to change colour to the direction that you want.
Re: XARD - Simple Trend Following Trading System
1423The candle and background will only change colour after it passes both MA lines.Daim2574 wrote: Wed Feb 12, 2020 12:40 am
Thanks. I understand that waiting for the candle may not help me ch as if the market keeps pushing in the direction opposite to the semafor color then it would just change its location regardless of the previous candle closing while the semafor is on it.... now, what does the background color represent?..... I was also thinking of waiting till both MA lines cross with the same color confirming the bias of the semafor color.... did anyone try that ?..
Re: XARD - Simple Trend Following Trading System
1424setup is almost ready.
I and perhaps others are now waiting for the confirmation of the background color from blue to red (= MAs, and Candle color) for this great Moment.
I and perhaps others are now waiting for the confirmation of the background color from blue to red (= MAs, and Candle color) for this great Moment.
We create order out of chaos - we trade that order, but sometimes that chaos is out of order, so we WAIT!!! for the order to return - and we trade again. XARD777
Re: XARD - Simple Trend Following Trading System
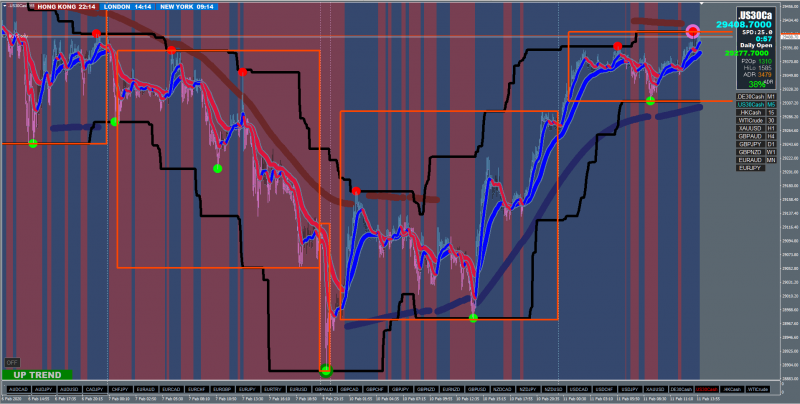
1425Everything is clear except the 2nd line on the postxard777 wrote: Tue Feb 11, 2020 10:44 pm Here is a chart showing 5 min Trading BIAS
Remember, you are trading a higher time frame (30 mins) on a 5 min chart.
We can see the 30 min Top and Bottom Cycle Semafor (Red/Lime Box)
We can see the 30 min White Dots (Pink/Green large Circle)
We can see the 5 min Red/Lime Dots
All on the one chart.
You just need to take a minute to get your head around it and see where the BIAS is at any one time during this 5 min road map.
Hope this helps
Xard777
I'm new at this so I am so sorry for asking this, but damm I can't see the "30 min Top and Bottom Cycle Semafor (Red/Lime Box)"
What exaclty is this Box? Is it the squares on 5 min TF? Because all of them are red, none is green even on big uptrends....
Can someone please explain this to me?
Thank you so much
Mario
Re: XARD - Simple Trend Following Trading System
1426Yes the squares you see is the box Xard is referring to.mario_lima wrote: Wed Feb 12, 2020 2:28 am
Everything is clear except the 2nd line on the post
I'm new at this so I am so sorry for asking this, but damm I can't see the "30 min Top and Bottom Cycle Semafor (Red/Lime Box)"
What exaclty is this Box? Is it the squares on 5 min TF? Because all of them are red, none is green even on big uptrends....
Can someone please explain this to me?
Thank you so much
Mario
Red square means you should look for a downtrend, green box means you should be looking for an uptrend. The box will show up on the 5 min chart but it's created based on the 30 min chart.
Re: XARD - Simple Trend Following Trading System
1427So once the entry semafor appears, we still have to wait for MA's and Candle colour to change? Just confirming as I know often the entry Semafor will appear before the background colour changes.Skyold wrote: Wed Feb 12, 2020 1:23 am setup is almost ready.
I and perhaps others are now waiting for the confirmation of the background color from blue to red (= MAs, and Candle color) for this great Moment.
Desktop Screenshot 2020.02.11 - 15.14.03.03.png
Re: XARD - Simple Trend Following Trading System
1428Wait for the candles and background colour to change if you want to reduce the risk of the semafor repainting.mikepilot89 wrote: Wed Feb 12, 2020 2:32 am
So once the entry semafor appears, we still have to wait for MA's and Candle colour to change? Just confirming as I know often the entry Semafor will appear before the background colour changes.
If you are OK to take more risk you can enter right when the semofor appear.
Re: XARD - Simple Trend Following Trading System
1429Ok , what does XARD do does he wait for background colour change or just enter on the semafor?navlem wrote: Wed Feb 12, 2020 2:37 am
Wait for the candles and background colour to change if you want to reduce the risk of the semafor repainting.
If you are OK to take more risk you can enter right when the semofor appear.
Re: XARD - Simple Trend Following Trading System
1430mikepilot89 wrote: Wed Feb 12, 2020 2:43 am
Ok , what does XARD do does he wait for background colour change or just enter on the semafor?
He already said what he does, few minutes ago, in post #1431