Thanks you so much for the quick response Implant and giving a detailed set of instructions. I will be studying these insights. Implant, Grateful for the guidance as ever.
Re: Okay .... Let's figure it out ...
292The main point that I want to avoid when creating my systems is a certain so-called filtering, which is not clear what is expressed. That is, in order to open a position on the M5 TF, I must first look where the major TFs is going and only after that open the position on the M5 towards the major TFs. At the same time, there are no clear unambiguous specifications on how to determine the type of trend, its presence on older TFs. Also, what if, say, H4 has an uptrend, H1 is uncertain, M15 is downward ... Which way to open a position on M5 ?? There are a lot of vague ambiguous moments that should not be in the work. Therefore, I always wanted to get rid of the need to solve this rebus every time. Therefore, what I am doing cannot be called filtration, or rather, I’ll definitely conduct an analysis of major TFs. Here is an example of an analysis of the current situation on SP500 ...
At H4 TF, the 4th point is formed, from which the uptrend continues
Н1 - uptrend. There is a second green dot of the wave counter, but the correction rollback from peak 1 is extremely small compared to wave 1. The PZ indicator displaying a possible start of a downward correction wave.
There are two different bearish patterns on the M15 and M5 timeframes. On both TFs, the 2nd point of the counter of downward waves was formed.
In my opinion, it seems very logical to roll back down to about 3060. Although I don't exclude the possibility of continuing further upward movement without a rollback. But in this case, I think that waves 3 and 5 on the H1 TF will be extremely low. In any case, I will not open upward from the current position. I completed the plan of the week on monday and now there is no point in taking risks.
Re: Okay .... Let's figure it out ...
293Implant,
Thanks for the detailed inputs. There is one aspect in which i am confused:
From your previous post:
"The semaphore indicator in this setup is non-repainting !!! This means that the points displayed by it, can only change in the direction of increasing significance, but never in the direction of decreasing! There are 3 types of points displayed by the indicator ...
1- black dot (minor), 2- red in the gray ring (middle), 3- red in the big yellow ring (major).
For example, a black dot may turn red later, but never vice versa!"
From the current Post:
I already wrote that semaphores in the system are not repaint, so you will never wait for a big yellow dot at the opening position. In the vast majority of cases, you will be dealing with black dots.
Please let me know if my understanding is correct and guide me as you see fit.
A Black Dot is a Child(Minor) which can transition to a red dot in A Grey Circle{Sub-major} and can further transition to a red dot in a Yellow Circle{Major}
In the previous iterations, the first thing we looked was for a Big Semaphore. In the current trading system, that is not the case. So, the first thing which will set the Bias and the first thing we always look for is the number 2 and all things come later?
Also, Semaphore and Wave Counter are two distinct entities. The semaphore also generates the Small Black dots which can be counted as well as the wave counter.
Basically, i am looking for guidance as to which component of the trading system would be the starting point that sets the Initial Trading Bias on the currently open Time Frame?
Apologize if it sounds like a dumb question.
Thank you
Re: Trading XARD system (Christmas Setup)
294As expected yesterday, the SP500 began a downward movement.
Working TF M15.
A sell position was opened according to the picture.
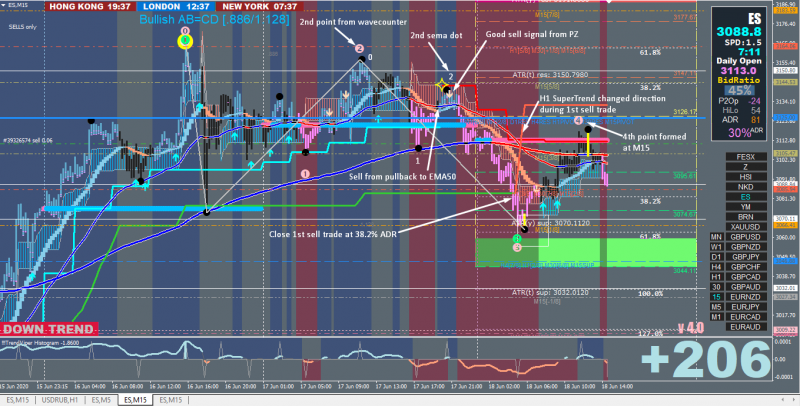
The position closed today at 38.2 ADRs.
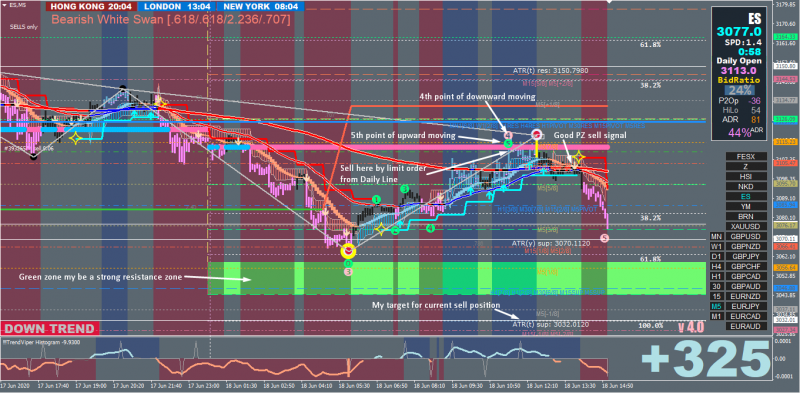
During this movement, the direction of the super trend indicator has changed. Therefore, I made an assumption that the downward movement will continue after the correction. Re-opened a selling position from Daily Line, as shown in the picture
Working TF M15.
A sell position was opened according to the picture.
The position closed today at 38.2 ADRs.
During this movement, the direction of the super trend indicator has changed. Therefore, I made an assumption that the downward movement will continue after the correction. Re-opened a selling position from Daily Line, as shown in the picture
Re: Trading XARD system (Christmas Setup)
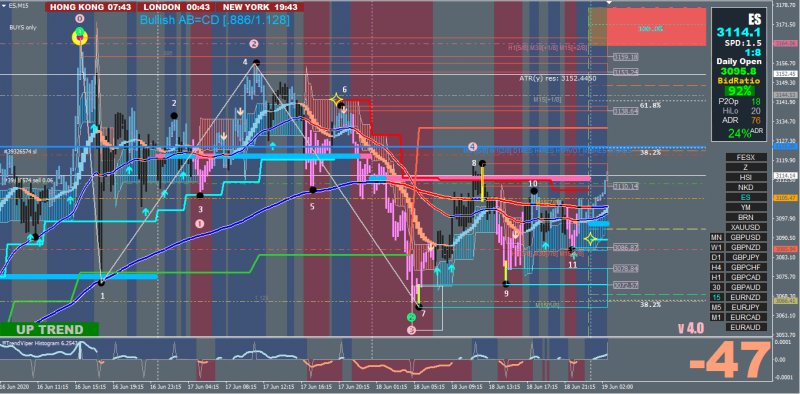
295An example of a very complicated situation for the semaphore and wave counter, which is happening now on the M15 timeframe ...
11 black points in a row !!! I have not seen this before. This suggests that the semaphore can not decide which vertices to raise the status until the price decides where to move it.
11 black points in a row !!! I have not seen this before. This suggests that the semaphore can not decide which vertices to raise the status until the price decides where to move it.
Re: Trading XARD system (Christmas Setup)
296I don't understand what you mean ...nasei wrote: Thu Jun 18, 2020 10:03 pm How to deal with small blue dot breaking new high and surpassing big red arrow
I have neither small blue dots, nor large red arrows. Obviously you messed up the thread ...
Re: Okay .... Let's figure it out ...
297P.S.aaven wrote: Thu Jun 18, 2020 10:06 pm
Implant,
Thanks for the detailed inputs. There is one aspect in which i am confused:
From your previous post:
"The semaphore indicator in this setup is non-repainting !!! This means that the points displayed by it, can only change in the direction of increasing significance, but never in the direction of decreasing! There are 3 types of points displayed by the indicator ...
1- black dot (minor), 2- red in the gray ring (middle), 3- red in the big yellow ring (major).
For example, a black dot may turn red later, but never vice versa!"
From the current Post:
I already wrote that semaphores in the system are not repaint, so you will never wait for a big yellow dot at the opening position. In the vast majority of cases, you will be dealing with black dots.
Please let me know if my understanding is correct and guide me as you see fit.
A Black Dot is a Child(Minor) which can transition to a red dot in A Grey Circle{Sub-major} and can further transition to a red dot in a Yellow Circle{Major}
In the previous iterations, the first thing we looked was for a Big Semaphore. In the current trading system, that is not the case. So, the first thing which will set the Bias and the first thing we always look for is the number 2 and all things come later?
Also, Semaphore and Wave Counter are two distinct entities. The semaphore also generates the Small Black dots which can be counted as well as the wave counter.
Congratulations!!! You have absolutely correctly dealt with the functionality and methods of the semaphore and wavecounter.
Now you have to bring your level to such a state that you will assume in advance how the numbers of the wavecounter and the semaphore points will change depending on the further price movement. That is, so to speak, to bring their skills to automatism. For this, I can advise one method .. Look at the current chart and ask yourself the question - what will happen to the counter digits and the semaphore points if the price rises sharply up or down right now? You should clearly understand the further behavior of these two indicators in different situations. And don't forget that sometimes, although not often, some numbers of the wavecounter can simply disappear when the indicator fails to correctly complete the counting cycle in any direction. I think you have already seen such situations. And this moment you must also learn to imagine and take into account. I understand that this is a very difficult task, but everything comes with experience.
Basically, i am looking for guidance as to which component of the trading system would be the starting point that sets the Initial Trading Bias on the currently open Time Frame?
I don't know how to answer this question unequivocally. A lot of factors are taken into account simultaneously in my mind when I decide to open a position. For this reason, I didn't prescribe any strict rules for using the system. Anyone who wants to use it should have a certain influx, you must learn to feel it from the inside. When this comes you will be rewarded for your work and efforts. Read carefully my posts, where I show in the pictures the moments that I pay attention to when opening a position, try to understand my logic, while developing your own.
Dear Aaven ... It is not necessary without special need to quote my entire message each time before writing your message. This complicates the perception of information, turning a thread into an endless scroll. Quote only when it is really necessary.
Re: Trading XARD system (Christmas Setup)
298Implant
Sorry about the quoting of message. Will keep this in mind. Thank you for letting me know.
Sorry about the quoting of message. Will keep this in mind. Thank you for letting me know.
Re: Trading XARD system (Christmas Setup)
299Implant-Thanks for the advice you have given in post#300. So back to watching charts and understanding the system better.
Re: Okay .... Let's figure it out ...
300Hi ImpLaNT,
First of all, many thanks for all the hard work and thanks again for sharing the results with us after this hard work.
At the moment, I cannot give an answer to the question of what experiences I have had. I am working with the last template XARD Universe on M15 and the work is not finished.
The super trend you have in your templates does a very good job that I taken. I adjusted the settings a little: current, period 16, multiplier 1.61. This setting is a confirmation of the entry and exit.
I see you are trading the index ES. I assume it is SAP500 (USA). If so:
Is there any reason for you to trade the ES as the DowJones index?
Is it trade volume or is it your personal choice?
Best regards
We create order out of chaos - we trade that order, but sometimes that chaos is out of order, so we WAIT!!! for the order to return - and we trade again. XARD777

