In stockmarket there mostly called continuation chart patterns like triangles (ascending, descending and symmetrical), channels (ascending, descending, rectangles), flags and wedges. They consist of two TLs, the bottom and the ceiling. In Forex these patterns are also known but it is quite undetermined where the price may go next. The market makes a reversal or continues in its trend. Buyers fight against sellers (or better: buyers want to shake off sellers and res versa) at support/resistance levels and who wins isn't very obvious at first.
Channels are often part of the trend and can be spotted easily. You can either trade the bounces (fake brakeouts) from the bottom or the ceiling or you wait for real breakouts. Triangles aren't that easy to identify while the market builds them. At least you can trade breakouts. But patience, you have to wait till the current candle closes inside or outside the fighting zone. The longer the pattern take, the bigger the following impulse, but don't be confused if the price retests the broken TL from outside.
PS: A little help is the attached indicator, but I recommend you to draw the patterns yourself. TL drawing is an art, not science.
Re: How good are Continuation Chart Patterns?
2Tobi,Krelian99 wrote:In stockmarket there mostly called continuation chart patterns
Good start of an valid and on going practically concept,appreciations
Indicator is just a tool.
Use it only if it can benefit you. Leave it if you don't know how to use it optimally.
Use it only if it can benefit you. Leave it if you don't know how to use it optimally.
Re: How good are Continuation Chart Patterns?
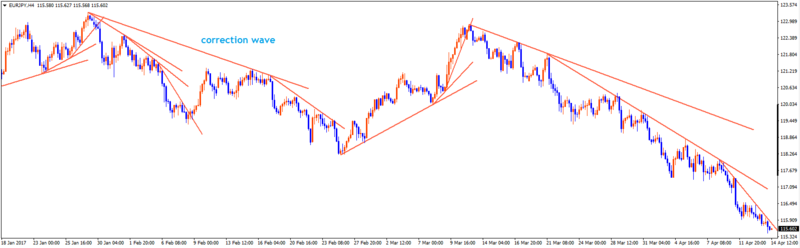
3I don't know whether following higher tf pattern has already a name. NTL, it consists of two or three TLs in a row getting steeper. More and more traders coming in following the trend till the trend ends abruptly as every hype has to end one day and a bigger correction or the counter trend follows. The longer and steeper the trend was, the quicker and steeper the counter trend. Exit your position before the new trend has established itself and look for new opportunities.