dynamic MyNET:
added Non-Linear Regression-adjusted QQE double
TASC magazine August 2022 issue, featured another variant of a moving average called “The Linear Regression-Adjusted Exponential Moving Average." Author Vitali Apirine presents a technique called the linear regression-adjusted exponential moving average (LRAdj EMA) to combine a linear regression indicator with an EMA. The indicator can be used to help define turning points while filtering price movement. The LRAdj EMA can be applied in combination with a traditional exponential moving average of the same length to facilitate trend identification.
By contrast, under the v2v dynamic trading system architecture or inside the dynamic MyNET tool...
The algorithm was applied to Non-Linear Regression-adjusted Quantitative Qualitative Estimation (QQE) double (NLR-adj QQE double). It then inherits all technologies used by the v2v dynamic trading system.
As a form of regression analysis, nonlinear regression involves fitting data to models and expressing the results mathematically. Compared to simple linear regression, which generates a straight line between two variables (X and Y) as if Y was a random variable, nonlinear regression must generate a curve (typically). This model aims to minimize the sum of squares.
An observation's sum of squares measures how far it varies from the data set's mean. It is computed by first finding the difference between the mean and every data point in the set. Then, each of those differences is then squared. Lastly, all of the squared figures are added together. The smaller the sum of these squared figures, the better the function fits the data points in the set. Nonlinear regression uses logarithmic functions, trigonometric functions, exponential functions, and other fitting methods.
To summarize the Difference between Linear and Nonlinear Regression Models...
The difference between linear and nonlinear regression models isn’t as straightforward as it sounds. You’d think that linear equations produce straight lines and nonlinear equations model curvature. Unfortunately, that’s not correct. Both types of models can fit curves to your data—so that’s not the defining characteristic. To know more on how to identify linear and nonlinear regression models >>> visit this URL
https://statisticsbyjim.com/regression/ ... on-models/
The difference between nonlinear and linear is the “non.” OK, that sounds like a joke, but, honestly, that’s the easiest way to understand the difference.
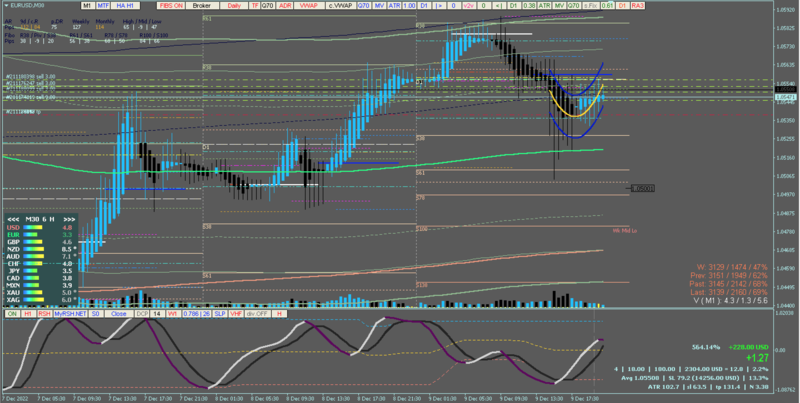
MTF mode (e.g. H1 TF)
M30 TF
Here is the current release... with additional optimizations.
New templates:
Once loaded, check/verify the indicator parameter if you prefer a recursive calculation is ON or OFF
Since Frank Sinatra sings in his own way, my charts sing... ♪ I did it, My... Way... ♬ ; )─