EUR/USD: updated chart before FOMC statements
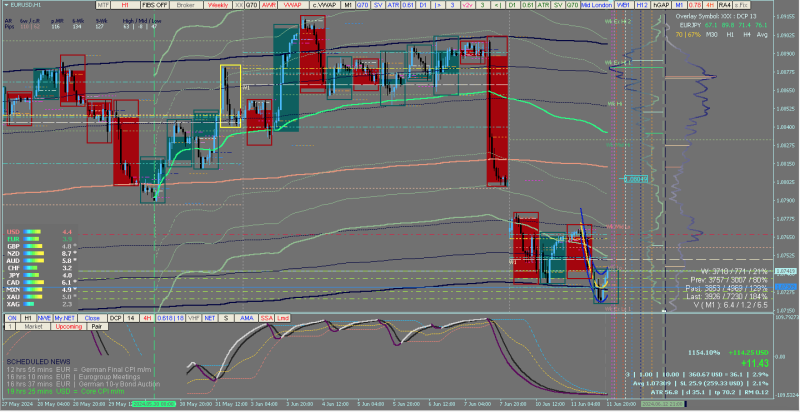
When analyzing the weekly market data, it's evident that my custom R78 area closely aligns with the traditional weekly pivot point. This is because my weekly pivot point is calculated using the Weekly Volume Weighted Average Price (VWAP), which represents the midpoint or 50% level of market activity.
The R78 area, commonly known in pivot trading circles, acts as a pivotal reversal point or an ideal location for setting the Take-Profit for certain pivot-based strategies. This region, calculated based on the midpoint of market activity, can be an advantageous location for identifying potential price reversals or locking in profits for traders who understand its significance. However, again... my weekly pivot point is calculated using the Weekly Volume Weighted Average Price (VWAP), which represents the midpoint or 50% level of market activity.
Considering the significant resistance at the R78 area for upward price movements and the nearby traditional weekly pivot point, being at or near it may suggest a potential upward or downward movement. Though, during FOMC it goes both ways, ha ha ha ha! LoLz... But in my biased opinion... Therefore, it is possible that the EUR/USD pair could experience downward pressure during the upcoming FOMC statement. However, it's important to note that certainty in financial markets is rare. While the R78 area suggests potential price decreases, market movements can be unpredictable, similar to a cat chasing a laser pointer.

 I wish!